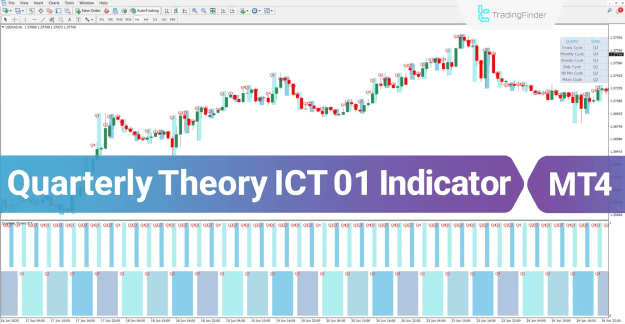
Additionally, this indicator features an integrated visual panel that presents complementary market data for each trading period, providing traders with deeper insights into price dynamics and overall market structure.
https://cdn.tradingfinder.com/file/5...4-by-tflab.zip
https://www.cryptocraft.com/thread/1...tatrader-5-mt5
https://www.forexfactory.com/thread/...-in-metatrader
Prop Firm DrawDown Protector : Prop Firm Capital Protection Expert MT4 | Forex Money Management: Forex Trade Management Expert MT4 |ICT Concepts Indicator MT4 | Smart Money Concepts Expert MT4| Smart Money Trap Scanner | Get a free Expert Advisor license via Telegram and WhatsApp
Key Features and Specifications of the Quarterly Theory ICT 01 Indicator
The Quarterly Theory ICT 01 Indicator stands among the most sophisticated analytical tools available for MetaTrader 4 (MT4). It integrates advanced ICT (Inner Circle Trader) concepts with precise time-based analysis, offering a professional-grade framework for market structure interpretation and trade execution.
Key Attributes
- Indicator Categories: ICT MT4 Indicators, Smart Money MT4 Indicators, Trading Assist MT4 Indicators
- Platform Compatibility: MetaTrader 4
- Required Skill Level: Advanced
- Indicator Type: Reversal Indicator
- Supported Timeframes: Multi-Timeframe Analysis
- Trading Styles: Day Trading, Scalping, and Swing Trading
- Applicable Markets: Forex, Stocks, and Cryptocurrency
Structure and Concept of the ICT Quarterly Theory 01 Indicator
The ICT Quarterly Theory 01 Indicator divides any chosen timeframe into four key market phases, known as quarters. Each quarter represents a distinct phase in the cyclical evolution of price behavior, allowing traders to anticipate potential market transitions with greater precision.
The Four Market Phases
- Q1 – Accumulation Phase:
The market consolidates within a confined range, signaling preparation for an upcoming move. - Q2 – Manipulation Phase:
Marked by sudden volatility and liquidity grabs, this phase initiates the true directional movement. - Q3 – Distribution Phase:
Price expands and distributes across a broader range, highlighting the maturity of the trend. - Q4 – Continuation or Reversal Phase:
The market either sustains the prevailing trend or shifts direction, completing the cycle.
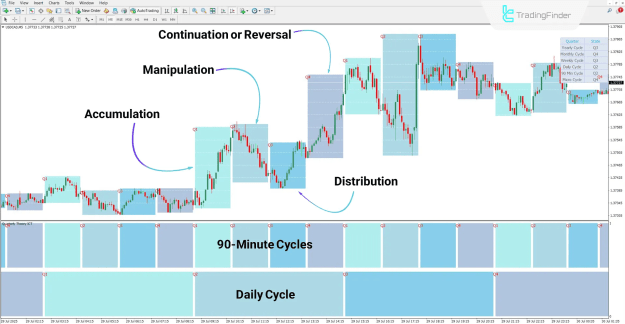
Application in Bullish Market Conditions
In a bullish setup, such as the USD/CAD pair on a 5-minute chart, the indicator divides the price action into clear quarterly cycles based on selected parameters. The typical progression follows this sequence:
- Accumulation: Price consolidates near the lower boundary of the range.
- Manipulation: Sharp volatility emerges as liquidity is taken out.
- Distribution: Price expands upward, establishing directional confirmation.
- Continuation: The bullish trend extends to higher market levels.
This structured visualization helps traders identify rhythm and align trading decisions with the dominant market phase.
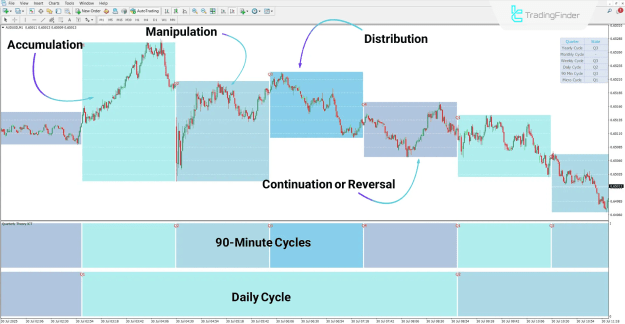
Application in Bearish Market Conditions
In a bearish scenario, such as the AUD/USD pair on a 1-minute timeframe, the indicator maps out each quarter during the downtrend.
The cyclical structure of each phase provides traders with a clear understanding of when potential reversals or continuations may occur, improving short-term decision-making and risk management.
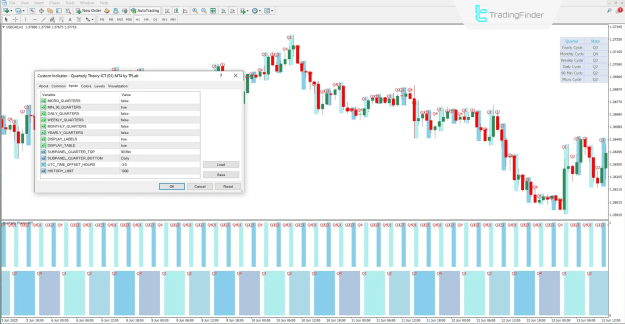
Adjustable Settings of the Quarterly Theory ICT 01 Indicator
The Quarterly Theory ICT 01 Indicator offers a comprehensive set of customizable parameters, enabling traders to adapt it to multiple trading styles and strategies:
- MICRO_QUARTERS: Toggle the visibility of micro time cycles.
- MIN_90_QUARTERS: Activate 90-minute cycle detection.
- DAILY_QUARTERS: Display divisions within daily timeframes.
- WEEKLY_QUARTERS: Visualize weekly cycle structures.
- MONTHLY_QUARTERS: Enable the display of monthly quarter divisions.
- YEARLY_QUARTERS: Show yearly cycle phases for macro-level analysis.
- DISPLAY_LABELS: Show or hide Q1–Q4 phase labels directly on the chart.
- DISPLAY_TABLE: Toggle the information table on the right-hand side.
- SUBPANEL_QUARTER_TOP / BOTTOM: Manage upper and lower timeframe subpanels.
- UTC_TIME_OFFSET_HOURS: Adjust the time offset relative to UTC.
- HISTORY_LIMIT: Define the number of historical candles included in calculations.
Conclusion
The Quarterly Theory ICT 01 Indicator delivers a methodical and visually intuitive approach to price cycle analysis by segmenting time into four repeating market phases—Accumulation, Manipulation, Distribution, and Continuation/Reversal.
By applying this model to multiple timeframes ranging from 90-minute to yearly charts, traders can achieve a higher degree of accuracy in timing entries and exits. The inclusion of a dynamic visual data table enhances situational awareness, making this indicator a valuable asset for advanced ICT-based strategies across Forex, stock, and cryptocurrency markets.