https://cdn.tradingfinder.com/file/5...5-by-tflab.zip
https://www.cryptocraft.com/thread/1...r-for-mt-4free
https://www.forexfactory.com/thread/...-in-metatrader
Prop Firm DrawDown Protector : Prop Firm Capital Protection Expert MT5 |Forex Money Management: Forex Trade Management Expert MT5 | ICT Concepts Indicator MT5 |Smart Money Concepts Expert MT5 | Smart Money Trap Scanner | Get a free Expert Advisor license via Telegram and WhatsApp
Indicator Overview and Categorization
This indicator falls into several advanced categories, making it a versatile tool for modern traders.
- Platform: Designed exclusively for MetaTrader 5.
- Trading Style: Suitable for Swing Trading, Scalping, and Day Trading strategies.
- Trading Instruments: Effective across Forex, Cryptocurrency, and Stock markets.
- Indicator Type: Functions as a Reversal and Multi-Timeframe indicator for skilled traders.
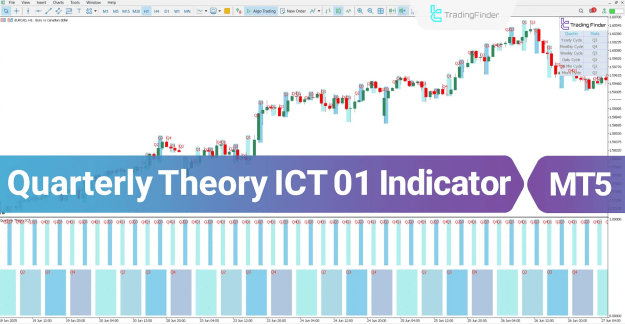
How the Quarterly Theory ICT 01 Indicator Works
The core mechanism of the indicator involves dividing the selected timeframe into four equal segments, known as "Quarters." Each quarter corresponds to a distinct stage of market behavior, providing a framework for anticipating price action.
- Q1 - Accumulation Phase: This is the market consolidation phase where the price typically moves within a range. It represents a period of preparation for the next significant directional move.
- Q2 - Manipulation Phase: This phase marks the beginning of the real trend, often characterized by sudden volatility and liquidity-seeking moves that can trap unprepared traders.
- Q3 - Distribution Phase: In this phase, the price action broadens as the trend becomes more widely recognized and participation increases.
- Q4 - Continuation or Reversal Phase: This is the decisive phase where the market either continues the established trend or experiences a full reversal, setting the stage for the next cycle.
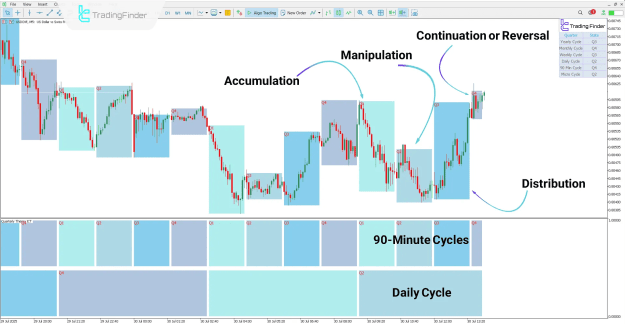
Identifying a Bullish Trend Setup
An analysis of a USD/CHF chart on a 5-minute timeframe demonstrates the indicator's application in a bullish context. The price movement begins logically from the Q1 Accumulation phase, where a base is formed. It then progresses into the Q2 Manipulation phase, often absorbing liquidity through deceptive moves. Following this, the price enters the Q3 Distribution phase and subsequently experiences significant upward growth, confirming the bullish trend. This structured progression allows traders to align their long entries with the phases of market strength.
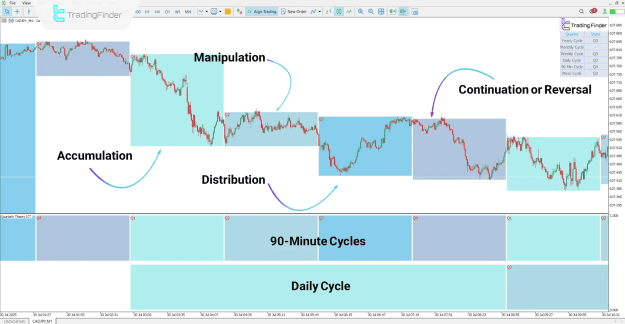
Analyzing a Bearish Trend Scenario
The indicator is equally effective in bearish markets, as seen on a CAD/JPY 1-minute chart. The four consecutive cycles appear sequentially, with the price reacting in accordance with the characteristics of each phase. The transition from distribution to a clear downward move in the manipulation and continuation phases helps traders identify the main directional flow of the bearish trend and pinpoint optimal short-selling opportunities.
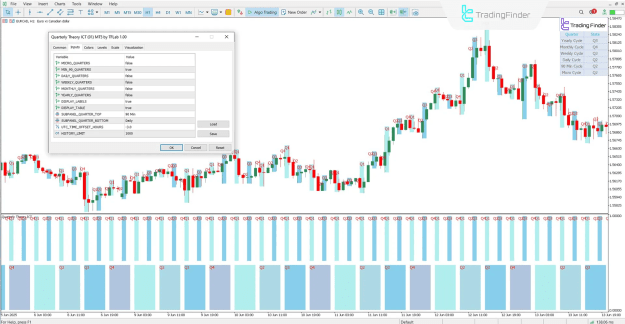
Comprehensive Settings Guide
The Quarterly Theory ICT 01 Indicator is highly customizable, allowing traders to tailor it to their specific strategy and preferred timeframes.
Key configuration options include:
- Cycle Visibility: Activate or deactivate cycles for different timeframes, including Micro, 90-Minute, Daily, Weekly, Monthly, and Yearly cycles.
- Display Features: Toggle the visibility of Q1–Q4 phase labels directly on the chart and display the time phase table in the right-hand panel for a quick reference.
- Subpanel Configuration: Designate upper and lower cycle timeframes to be displayed in a separate subpanel below the main chart for multi-timeframe analysis.
- Technical Adjustments: Set the UTC time offset to align with your broker's time and define the history limit for calculation purposes to optimize performance.
Conclusion
The Quarterly Theory ICT 01 Indicator empowers traders to conduct a structured analysis of price behavior by segmenting time into four distinct, consecutive phases. This powerful tool is applicable across a wide range of timeframes, from intraday 90-minute cycles to long-term monthly and yearly analyses. By clarifying the market's current phase—be it Accumulation, Manipulation, Distribution, or Continuation/Reversal—it significantly aids in the identification of precise market entry and exit points, enhancing trading decision-making.