Prop Firm DrawDown Protector : Prop Firm Capital Protection Expert MT4 |Forex Money Management: Forex Trade Management Expert MT4 |ICT Concepts Indicator MT4 | Smart Money Concepts Expert MT4| Get a free Expert Advisor license via Telegram and WhatsApp
How the Can Can Pattern Works
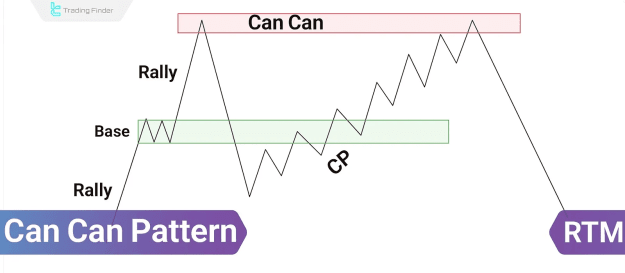
The Can Can Pattern unfolds in four critical stages:
- Break of a Key Level – Price breaches a strong RBR (Resistance Becomes Resistance) or DBD (Demand Becomes Demand) zone.
- False Breakout & Liquidity Grab – Price extends beyond the broken level, triggering stop-loss orders and trapping breakout traders.
- Quick Return to Structure – The price swiftly reverses back into the original range, invalidating the breakout.
- Internal Structure Break – A decisive move in the opposite direction confirms the reversal.
This sequence highlights market maker manipulation, where false breakouts are used to collect liquidity before reversing the trend.
Key Identification Criteria for the Can Can Pattern
To validate a Can Can Pattern, traders should look for the following signals:
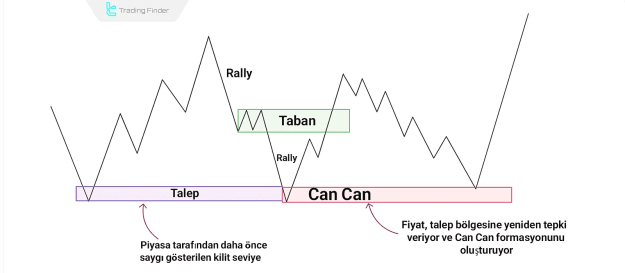
1. Formation at a High-Probability Zone
- The pattern typically forms at strong supply/demand zones or areas with stacked retail stop-losses.
- Previous multiple reactions at the level increase its significance.
2. Strong Breakout Candle (False Breakout)
- A large, high-volume candle breaks the key level, creating the illusion of a continuation.
- Retail traders are lured into entering in the breakout direction.
3. Rapid Rejection & Return to Structure
- Price quickly reverses into the original range, indicating a lack of follow-through.
- The absence of confirmation suggests a liquidity grab rather than a genuine breakout.
4. Internal Structure Break (Reversal Confirmation)
- A decisive break of an internal level (e.g., swing high/low) confirms the reversal.
- This shift indicates smart money’s true intent, leading to a sustained move.
Advanced Trading Tips for the Can Can Pattern
To enhance the effectiveness of this setup, consider the following:
1. Strong Flag Limit (FL) Confirmation
- The pattern is more reliable when forming near a well-defined Flag Limit (FL)—a key decision zone for institutional traders.
2. Higher Timeframe Alignment
- The Can Can Pattern is most effective on H1, H4, or daily charts, where price action is cleaner and less prone to noise.
3. Liquidation Clusters
- If the pattern forms near liquidation zones (where stop-losses are clustered), it signals a higher probability of a reversal.
Real-World Example of the Can Can Pattern
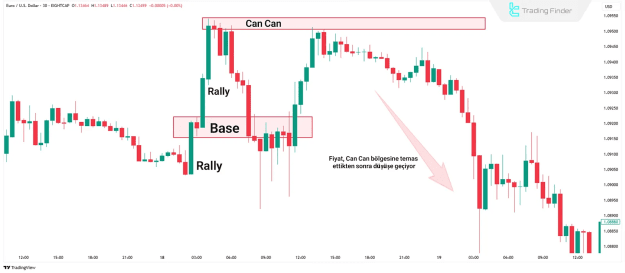
On a 30-minute EUR/USD chart, the following sequence occurs:
- Price forms an RBR structure and taps into a supply zone.
- After a reaction, it returns to the base, breaks below, and collects liquidity.
- Price then revisits the broken zone (Caps), fails to sustain, and aggressively reverses.
- A bearish trend resumes, confirming the Can Can Pattern.
Common Mistakes When Trading the Can Can Pattern
Despite its effectiveness, traders often make these errors:
- Misidentifying the Structure – Not every reversal is a Can Can; it must include a false breakout, compression, and internal break.
- Premature Entries – Entering before the internal structure break increases risk.
- Ignoring Market Context – The pattern must align with higher timeframe trends and liquidity zones.
Conclusion: Mastering the Can Can Pattern in RTM
The Can Can Pattern is a powerful RTM strategy for identifying false breakouts and true reversals. It thrives in zones where liquidity is concentrated, and smart money manipulates price to trap retail traders.
For optimal results, traders should:
![]() Confirm the pattern at strong RBR/DBD zones.
Confirm the pattern at strong RBR/DBD zones.
![]() Wait for the internal structure break before entering.
Wait for the internal structure break before entering.
![]() Align trades with higher timeframe trends and liquidation clusters.
Align trades with higher timeframe trends and liquidation clusters.