How to Identify ICT Daily Bias?
Recognizing daily bias requires a detailed analysis of price behavior and institutional activity. The following core elements should be evaluated:
1. Daily Timeframe Order Flow
- The daily chart reflects the order flow used by banks and institutional traders.
- Understanding the directional bias on the daily timeframe helps anticipate the market’s likely movement.
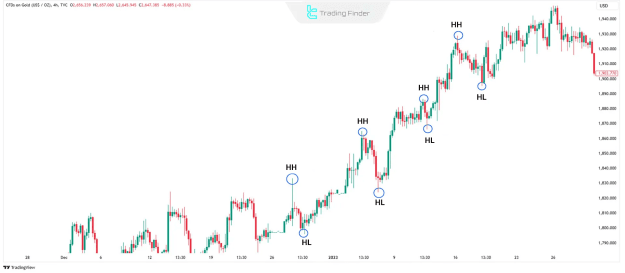
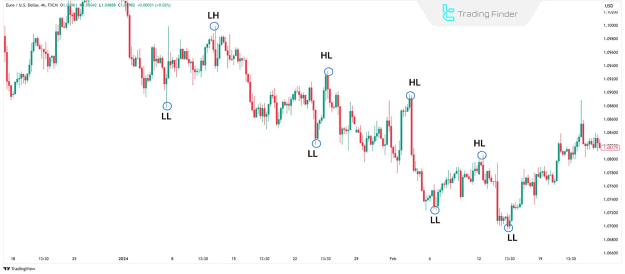
- Consistent higher highs and higher lows suggest a bullish order flow, whereas lower highs and lower lows indicate a bearish order flow.
2. Imbalance and Rebalancing Zones
- Markets often move to resolve price imbalances.
- Identifying zones of imbalance enables traders to anticipate corrective moves as the market seeks to rebalance.
- These zones act as potential entry or exit levels in line with the daily bias.
3. Liquidity Targets
- One of the key drivers of price action is liquidity hunting.
- Prices tend to move toward liquidity pools such as previous highs and lows.
- Understanding this dynamic aids in predicting breakout or reversal zones.
Key Features of Daily Bias
- Aligns trades with the dominant market direction
- Helps avoid losses from counter-trend trades
- Enables precision in trade entries and exits
- Enhances risk-to-reward ratios by reducing market noise
Identifying Order Flow on the Daily Chart
Order flow reflects the underlying market structure and is used to assess current directional momentum.
Bullish Order Flow
- Characterized by higher highs and higher lows
- Suggests the market is absorbing liquidity on its way upward
- Focus should be on buy setups
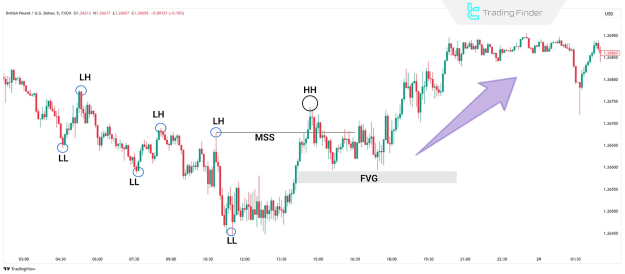
Bullish ICT Daily Bias Setup:
- Look for price to reach key levels like Order Blocks, Breaker Blocks, or Fair Value Gaps
- Monitor lower timeframes for a Market Structure Shift (MSS)
- Enter trades upon confirmation, targeting liquidity and imbalance areas
Bearish Order Flow
- Characterized by lower highs and lower lows
- Indicates the market is moving downward to capture sell-side liquidity
- Focus should be on sell setups
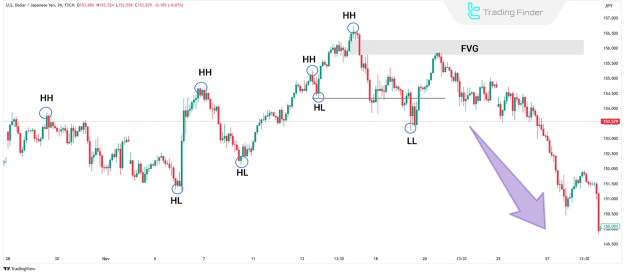
Bearish ICT Daily Bias Setup:
- Identify bearish key levels such as Order Blocks and Fair Value Gaps
- Wait for price interaction and signs of bearish structure change
- Enter trades targeting downside liquidity or imbalance zones
Importance of ICT Daily Bias in Trading
Understanding and implementing ICT Daily Bias offers numerous advantages:
1. Enhanced Decision-Making
- Prevents initiating trades that go against the prevailing trend
- Supports high-probability trade setups
2. Increased Accuracy
- Enables precise trade entries and exits
- Reduces the chance of false signals and unnecessary losses
3. Better Risk Management
- Knowing the daily bias shields traders from unexpected reversals
- Aligns risk parameters with the market’s directional flow
4. Liquidity Alignment
- Markets gravitate toward high-liquidity areas
- Daily bias guides traders to these zones for optimal execution
Applying the ICT Daily Bias Strategy
Trading Bullish Daily Bias
- Identify a bullish bias on the daily chart
- Recognize institutional levels such as:
- Order Blocks
- Breaker Blocks
- Fair Value Gaps
- Use intraday timeframes to detect confirmation via Market Structure Shifts
- Execute trades aiming to capture upward liquidity and resolve imbalances
Trading Bearish Daily Bias
- Establish a bearish outlook using daily market structure
- Identify bearish key levels where price might reverse
- On smaller timeframes, wait for confirmation through bearish structure shifts
- Enter short trades once confirmed, targeting liquidity zones or imbalance corrections
Conclusion
The ICT Daily Bias is an essential part of the ICT methodology, serving as a strategic compass for traders. By integrating key principles like order flow, liquidity zones, and price imbalances, traders can significantly improve the consistency and accuracy of their trading decisions.
This approach helps avoid counter-trend trades, enhances entry precision, and contributes to overall portfolio risk management in today's dynamic financial markets.