- Short-Term (STH/STL) – Minor swing points for intraday traders
- Intermediate-Term (ITH/ITL) – Stronger pullback levels for swing trading
- Long-Term (LTH/LTL) – Major trend-defining extremes for position traders
This framework is essential in Forex Education , helping traders identify Break of Structure (BOS), Change of Character (CHoCH), and high-probability trade setups across all timeframes. Whether trading bullish, bearish, or ranging markets in Forex, mastering these structural levels enhances precision in entries, exits, and trend analysis—key skills for any serious Forex trader.
STH & ITH & LTH Indicator:
STH & ITH & LTH Indicator MT4
STH & ITH & LTH Indicator MT5
STL & ITL & LTL Indicator:
STL & ITL & LTL Indicator MT4
STL & ITL & LTL Indicator MT5
What Is Market Structure?
Market structure refers to the pattern of price movements within a specified timeframe. By analyzing highs and lows, traders can identify trends, breakouts, and potential reversals. Understanding market structure is essential for making informed trading decisions.
Types of Market Structure
Market structure can be categorized into three primary types:
- Bullish Market Structure – Characterized by consistent higher highs (HH) and higher lows (HL), indicating an uptrend.
- Bearish Market Structure – Defined by lower lows (LL) and lower highs (LH), signaling a downtrend.
- Sideways Market Structure – Prices fluctuate within a range, with highs and lows forming at similar levels.
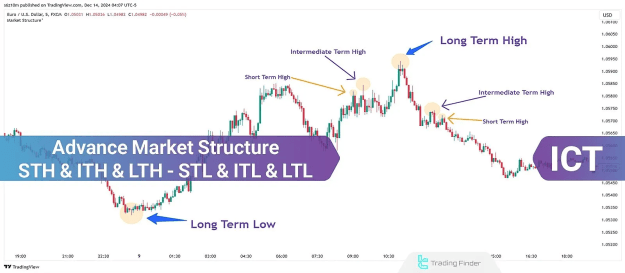
Advanced Market Structure in ICT Style
The ICT (Inner Circle Trader) methodology introduces an advanced classification of market structure using:
- Highs: Short-Term High (STH), Intermediate-Term High (ITH), Long-Term High (LTH)
- Lows: Short-Term Low (STL), Intermediate-Term Low (ITL), Long-Term Low (LTL)
This framework helps traders identify key levels for breakouts, reversals, and trend continuations.
Types of Highs in Advanced Market Structure
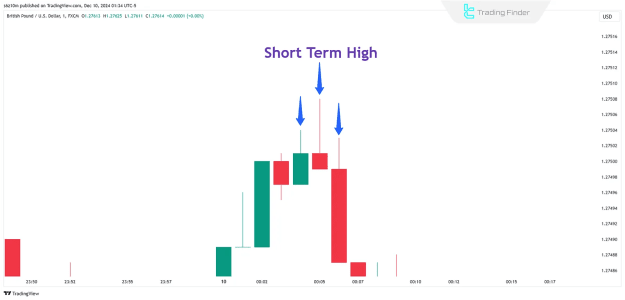
1. Short-Term High (STH)
A Short-Term High (STH) is a swing high formed by three candles, where:
- The middle candle’s high is greater than the highs of the adjacent left and right candles.
- This indicates a minor resistance level within a short timeframe.
Example:
- Left candle high: $100
- Middle candle high: $105
- Right candle high: $102
- STH is confirmed at $105.
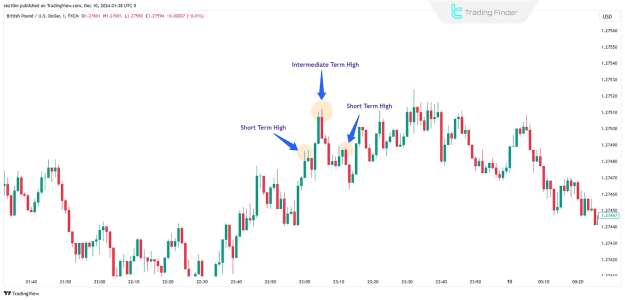
2. Intermediate-Term High (ITH)
An Intermediate-Term High (ITH) is a higher STH positioned between two lower STHs.
- Acts as a stronger resistance level than an STH.
- Often forms during pullbacks within a trend.
Example:
- Left STH: $100
- Middle STH (ITH): $110
- Right STH: $105
- ITH is confirmed at $110.
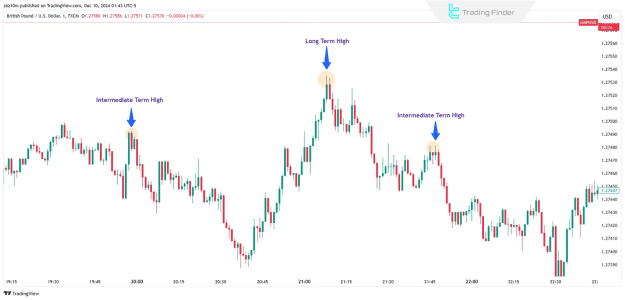
3. Long-Term High (LTH)
A Long-Term High (LTH) is the highest ITH within a broader trend.
- Forms after a price reaction in a Premium/Discount (PD) zone.
- Surrounded by two lower ITHs, confirming a major resistance level.
Example:
- Left ITH: $115
- Middle ITH (LTH): $120
- Right ITH: $118
- LTH is confirmed at $120.
Types of Lows in Advanced Market Structure
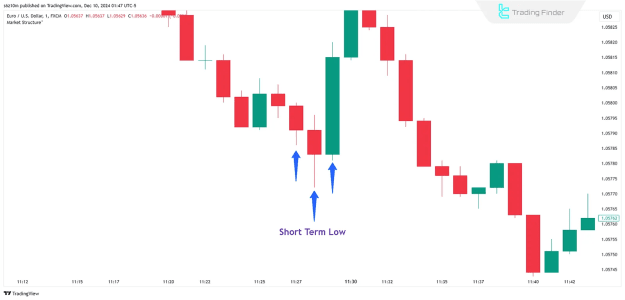
1. Short-Term Low (STL)
A Short-Term Low (STL) is a swing low formed by three candles, where:
- The middle candle’s low is lower than the adjacent left and right candles.
- Indicates minor support within a short timeframe.
Example:
- Left candle low: $90
- Middle candle low: $85
- Right candle low: $88
- STL is confirmed at $85.
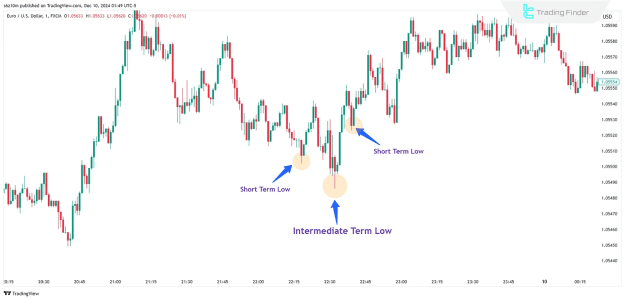
2. Intermediate-Term Low (ITL)
An Intermediate-Term Low (ITL) is a lower STL between two higher STLs.
- Acts as a stronger support level than an STL.
- Often forms during retracements in a downtrend.
Example:
- Left STL: $95
- Middle STL (ITL): $90
- Right STL: $92
- ITL is confirmed at $90.
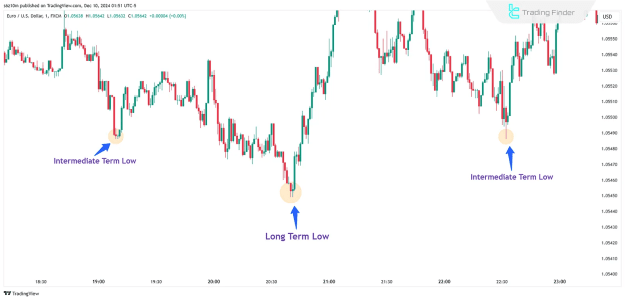
3. Long-Term Low (LTL)
A Long-Term Low (LTL) is the lowest ITL within a broader trend.
- Typically forms after a reaction in a Premium/Discount (PD) zone.
- Surrounded by two higher ITLs, confirming a major support level.
Example:
- Left ITL: $80
- Middle ITL (LTL): $75
- Right ITL: $78
- LTL is confirmed at $75.
Conclusion
Understanding Advanced Market Structure in ICT style enhances a trader’s ability to:
- Identify Break of Structure (BOS) and Change of Character (CHoCH).
- Recognize trend continuations and reversals.
- Utilize STH/STL, ITH/ITL, and LTH/LTL for strategic entries and exits.
In a bullish trend, prices form higher highs and higher lows until a lower low breaks, signaling a potential reversal.
In a bearish trend, prices make lower lows and lower highs until a higher high breaks, indicating a possible trend shift.
By mastering these concepts, traders can refine their market analysis and improve decision-making in various trading environments.