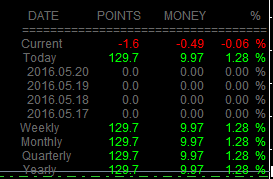
Disliked{quote} It has come out very nicely, better than as contemplated by me to catch seasonal trends. Fantastic job. If I use different dates to compare trends of say two dates say 15th to 25th, it is showing both lines. That's exactly I wanted to compare trends in the past. 1. I just want to understand what does the switch "delete lines" do? 2. Can the scrip, in any timeframe of chart, connect high and low of the period and draw a trend line to print in text drawdown in percentage and pips. {image} 3. Ideal will be an indicator which can work in each...Ignored
on #1 if you set to false you can plot lines on multiple days of the mon/yr
on #2 answer is no
on #3 not something I would be interested in coding