Yes, also that was inspired by Emptymind comment about fractal. Comparing this November timeframe to a daily chart for nov,dec,jan is interesting.
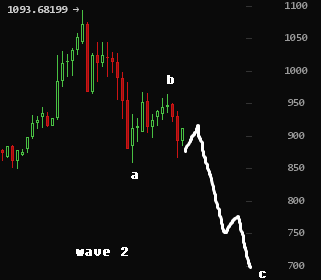
The second diagonal after the III peak, did redrew it self in a larger diagonal three times. Back then it wasn't as obvious as now because of the price euphoria and it only lasted a few days, not a few weeks.
Kinda hard to draw without making it a maze of overlaping line, but something like that
http://i.imgur.com/vJMRzfx.jpg