Financial Markets Observatory Lab.
Some notes about Stress Indicators.
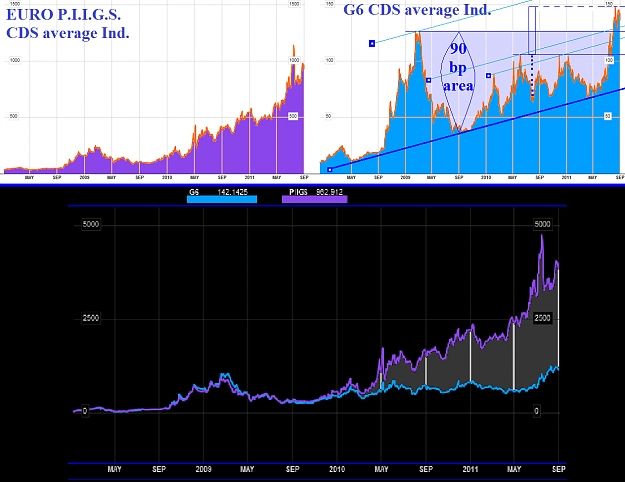
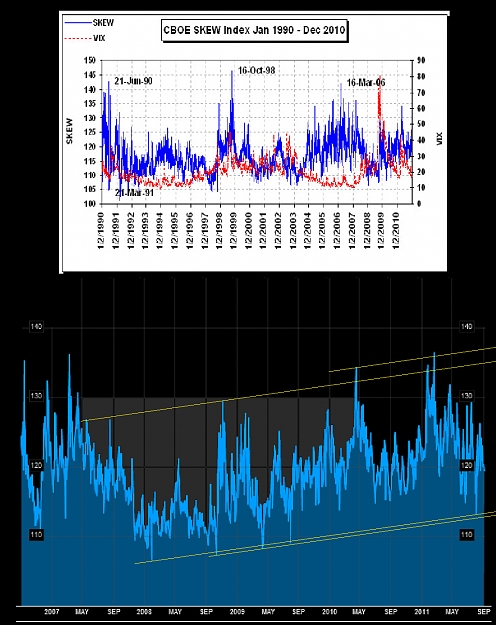
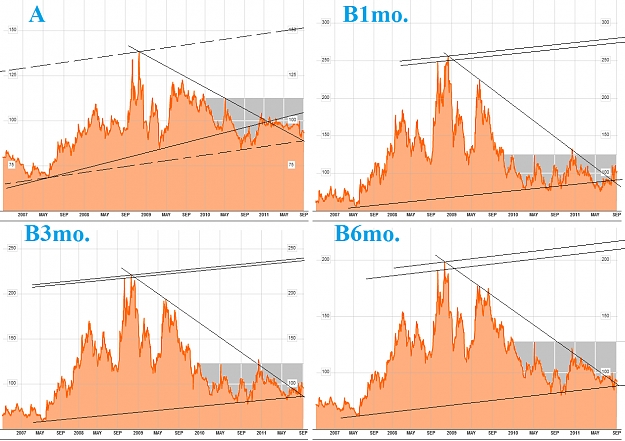
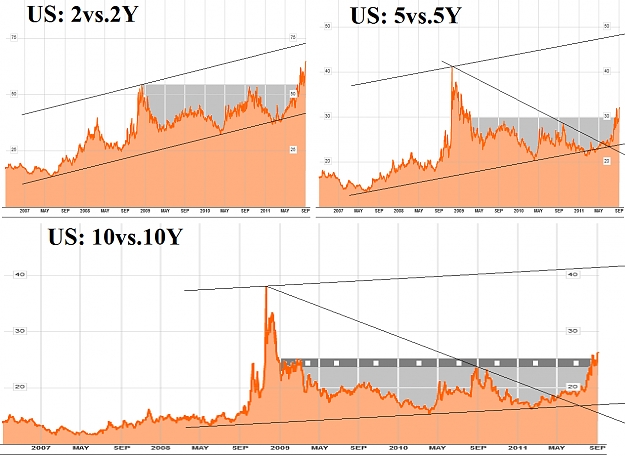
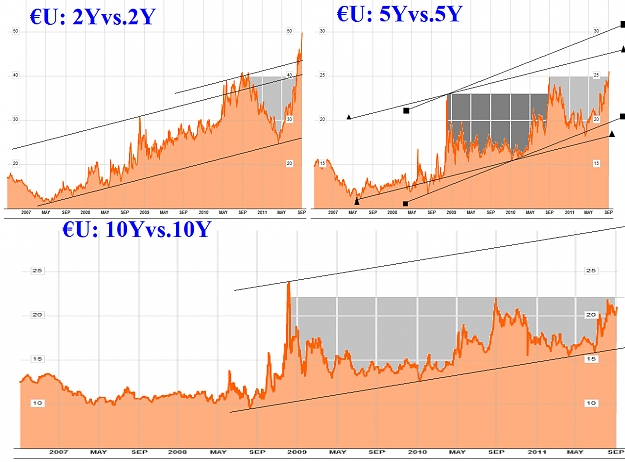
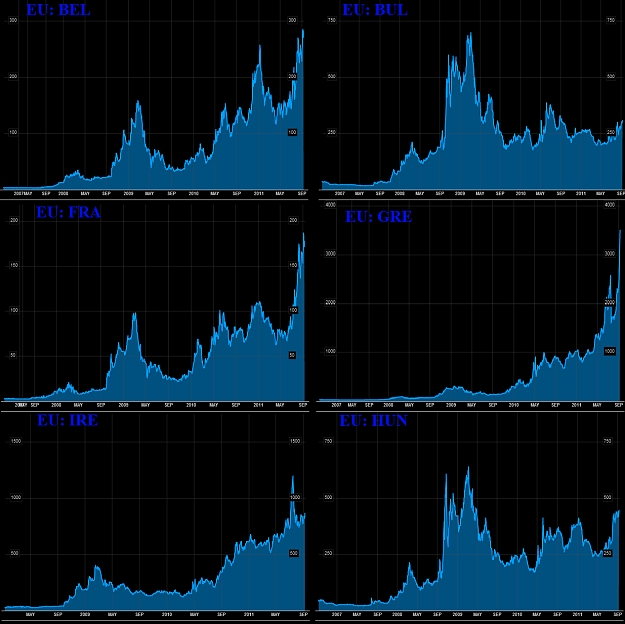
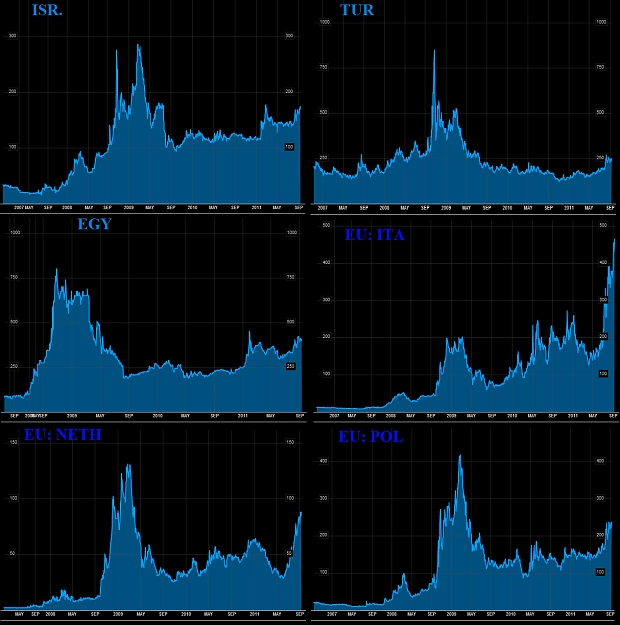
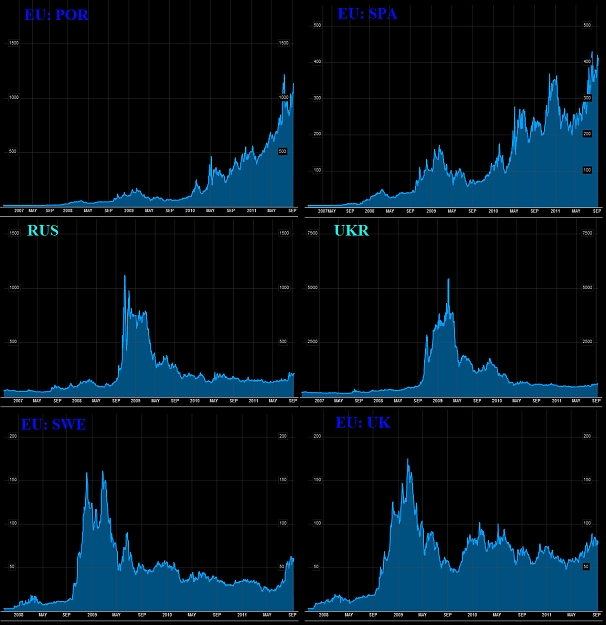
These charts shows the 1y and 5y CDS indexes for Euro P.I.I.G.S. countries and G6 average.
Possible underlying benchmarks are:
► global U.S. stocks-benchmarks (charts & notes: ISI; IWV; IYY; TMW);
► global World stocks-benchmarks (charts & notes: ACWI; DGT; IOO; ONEF; VT).
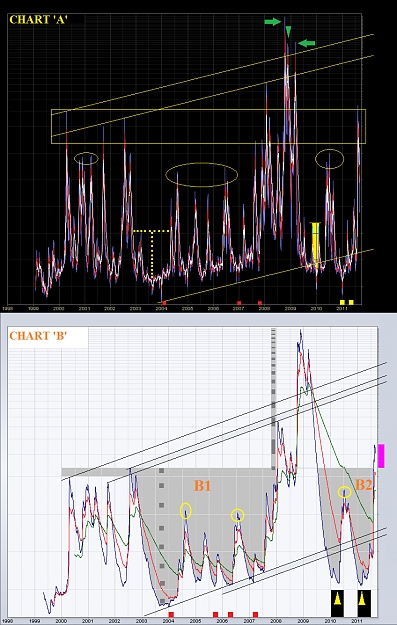
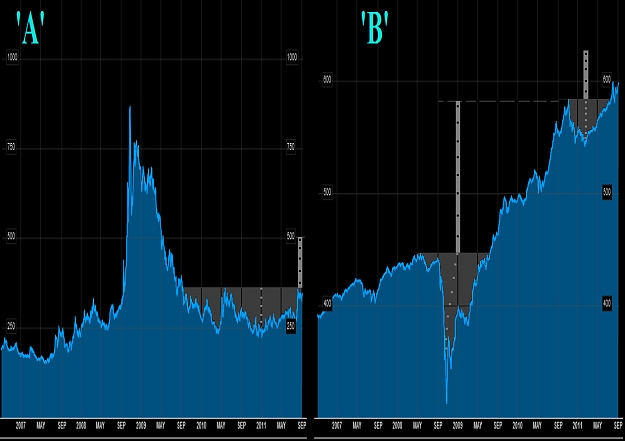
The bullish array of G6 is very impressive (see main ascending lines) with a transfections-zone P.I.I.G.S. ►►► G6 in 2011.
Two monster bullish structures are in progress (two blue-area cups) on G6 curve.
-) The minor cup is bull-validated (2011-summer) with target as blue-bar, and completed in 2011 tops.
-) The major cup, if bull-validated (curve now is above the neck or 2009-top !!!), has a 'Melt-Down' impact on underlying stocks-benchmarks (90 b.p. above the neck !!!).
Is the G6 curve do not stop the bull in action above 2009-top it is very probable that the market go to SLS black-out (Stability, Liquidity, Solvency).
☻/ ۞ Alert on stress indicators ۞
/▌
/|
Tuned on main trend, and follows short-medium term signs from underlying prices, for a real-time and correct set-up.
It is very important do not anticipate the main trend of the underlying financial instruments.
K€SADDhAPHA'pe'KAMPA' €MP¥R€ Bund@Bund@-$0UND $¥$T€M$ ❣❣❣
ⒾⓂⓄ ℬϒ $@❣♆¥ ♥ █║▌│█│║▌║▌║| █
  ❤
❤
EURO P.I.I.G.S. CDS:
1y FRAME
http://www.bloomberg.com/apps/chart?...%3AIND&img=png
G6 CDS:
1y FRAME
http://www.bloomberg.com/apps/chart?...%3AIND&img=png
EURO P.I.I.G.S. vs. G6 CDS:
5y FRAME
۞
H! ALL [ bad English, sorry ⊱ : ( ]Some notes about Stress Indicators.
These charts shows the 1y and 5y CDS indexes for Euro P.I.I.G.S. countries and G6 average.
Possible underlying benchmarks are:
► global U.S. stocks-benchmarks (charts & notes: ISI; IWV; IYY; TMW);
► global World stocks-benchmarks (charts & notes: ACWI; DGT; IOO; ONEF; VT).
The bullish array of G6 is very impressive (see main ascending lines) with a transfections-zone P.I.I.G.S. ►►► G6 in 2011.
Two monster bullish structures are in progress (two blue-area cups) on G6 curve.
-) The minor cup is bull-validated (2011-summer) with target as blue-bar, and completed in 2011 tops.
-) The major cup, if bull-validated (curve now is above the neck or 2009-top !!!), has a 'Melt-Down' impact on underlying stocks-benchmarks (90 b.p. above the neck !!!).
Is the G6 curve do not stop the bull in action above 2009-top it is very probable that the market go to SLS black-out (Stability, Liquidity, Solvency).
☻/ ۞ Alert on stress indicators ۞
/▌
/|
Tuned on main trend, and follows short-medium term signs from underlying prices, for a real-time and correct set-up.
It is very important do not anticipate the main trend of the underlying financial instruments.
K€SADDhAPHA'pe'KAMPA' €MP¥R€ Bund@Bund@-$0UND $¥$T€M$ ❣❣❣
ⒾⓂⓄ ℬϒ $@❣♆¥ ♥
EURO P.I.I.G.S. CDS:
1y FRAME
http://www.bloomberg.com/apps/chart?...%3AIND&img=png
G6 CDS:
1y FRAME
http://www.bloomberg.com/apps/chart?...%3AIND&img=png
EURO P.I.I.G.S. vs. G6 CDS:
5y FRAME
Attached Image (click to enlarge)