{quote} int min = maxcount*Porcent; min /= 100; Print("maxcount="+maxcount+" min="+min); int range = maxcount- min; if (range<5) range=5; id = 0; /////// Print("count",count); //////// for (i=0;i<count;i++) { if (counter > min) { price = index * Point; name = "----------line---------"+id; id=id+1; c = counter; ObjectCreate(name,OBJ_HLINE,0,0,price); 2023.02.03 09:25:49.954 mslmsh ETHUSD,H1: count1111 2023.02.03 09:25:53.687 mslmsh ETHUSD,H1: maxcount=3 min=0 2023.02.03 09:25:53.687 mslmsh ETHUSD,H1: count1111 2023.02.03 09:25:54.039 mslmsh...
Ignored
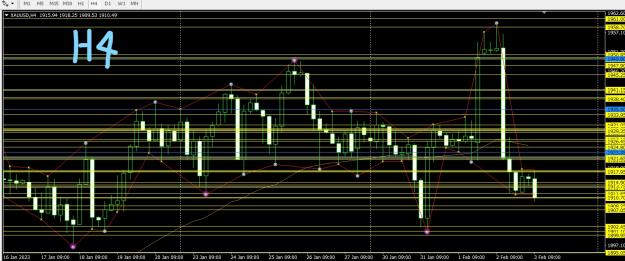
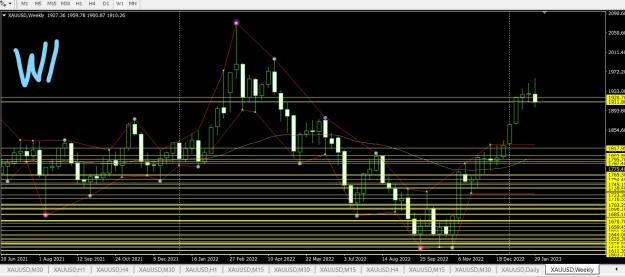
Kourosh, Good day.
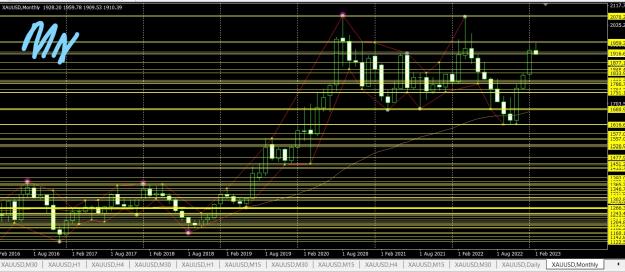
The yellow lines are still showing when the indicator is attached to H4, W1 and MN charts buy=t not on M1, M5, M15, M30, H1 and D1 charts
These yellow lines do not allow me draw the supports lines on the H4, W1 and MN charts
Please what do I do to remove these yellow lines as shown in the 3 TFs on which the lines are appearing
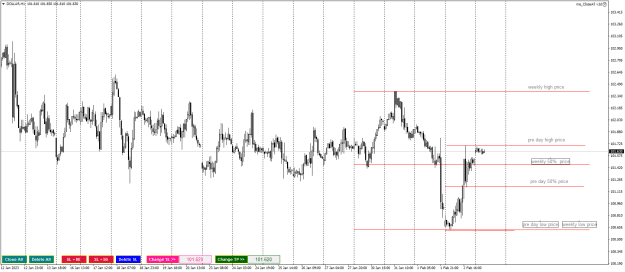
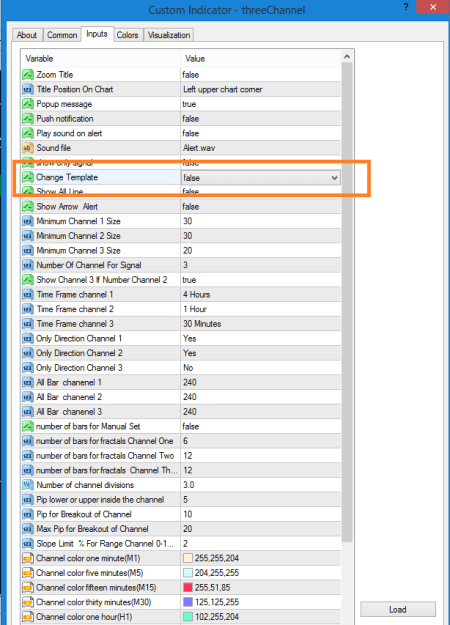
Hi I have an indicator to be modified {image} The default shows like above. What I need is it should plot horizontal lines instead of the that dotted line and dont show the SR lines if it was taken off{file}
{quote} Kourosh, Good day. The yellow lines are still showing when the indicator is attached to H4, W1 and MN charts buy=t not on M1, M5, M15, M30, H1 and D1 charts These yellow lines do not allow me draw the supports lines on the H4, W1 and MN charts Please what do I do to remove these yellow lines as shown in the 3 TFs on which the lines are appearing Thank you for your assistance {image}{image}{image}
Ignored
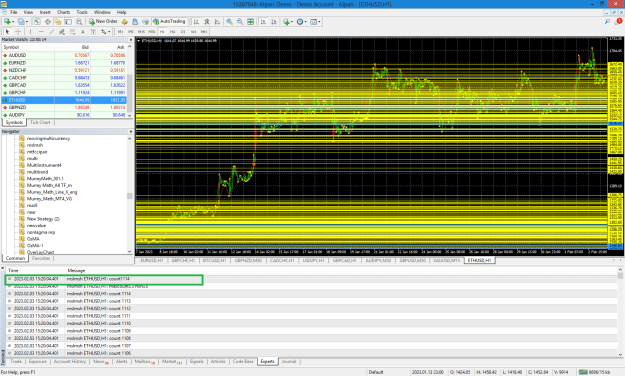
As I have shown, you have a variable called count whose value is equal to 1111 and as a result it draws the same number of lines
{quote} It is used in your program . if (!found) { index[count] = pips; counter[i] = 1; count++; Print("count ",count); } Print("count",count); for (i=0;i<count;i++) { if (counter[i] > min) { price = index[i] * Point; name = "----------line---------"+id; id=id+1; c = counter[i]; ObjectCreate(name,OBJ_HLINE,0,0,price); {image}
Ignored
That's a very large for loop if count is equal to 1111
A- Close old position if a new open position is the opposite regardless of the symbol
Keeping in mind that the USD CAD or USD CHF will be opposite in the buy and selling
Ex:
Open Positions:
Buy AUD USD at 0.622
BUY NZD USD at 0.57
Pending Order
Buy Stop USD CAD at 1.34
Nothing will happen
Executed
Buy USD CAD at 1.34
Now close the AUD USD and NZD USD at any rate and keep the USD CAD
B- The money management
Set an input for the Stop Loss and Take Profit to be pips
C- The Lot Volume
To be calculated based on
0.2 Lot for the 10,000 Per each position
0.2 = To be an input in the EA
The next position is calculated based on Account Equity not balance
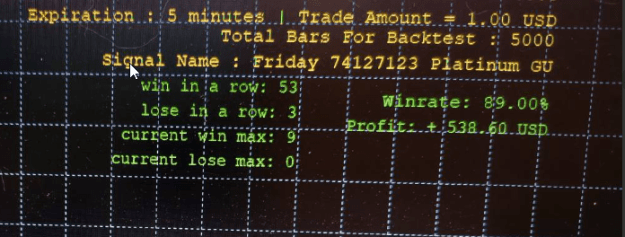
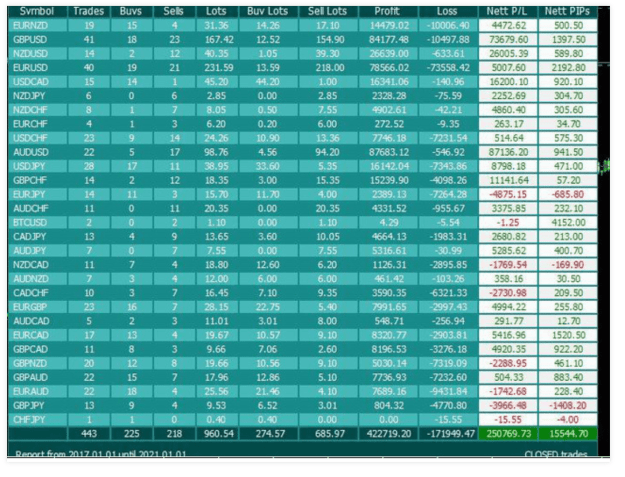
I need an indicator that can show me my last trades. Why this is important for me? With the knowledge of my previous tredes I can decide what to do next.
I found an interesting indicator in mql5 www site but it groupes trades together by symbol. It would be nice to see it by specific trade and with the info of % loss or gain.
Great Coders, can you make it possible to change the color of background and candle sticks in this indicator? Anytime i change the colors, and switch time frames, the revert to black background and default color of the candles sticks.
Thanks.
Great Coders, can you make it possible to change the color of background and candle sticks in this indicator? Anytime i change the colors, and switch time frames, the revert to black background and default color of the candles sticks. Thanks.{file}