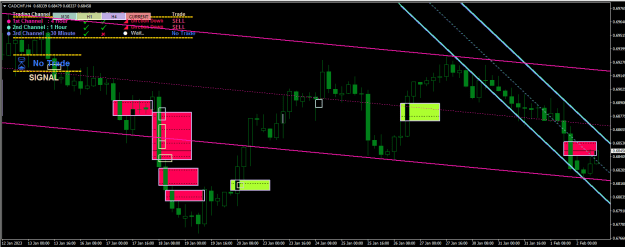
Disliked{quote} jeanlouie / cja / mntiwana, jagg I have recoded indicator with same expectations, removed Fibonacci and added H-lines. I was completed almost 85-90% work with my half knowledge. Now I require professional coders help. I want this indicator to find M5 Chart lowest close and highest close prices within Start and End-time zone even we are in other TF chart. {image} {file}Ignored
jeanlouie / cja will you guys look into my request ? I am waiting for your response from past 4 days.
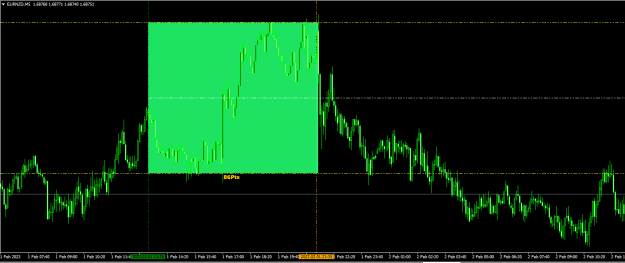
My indicator will draw a box tStart / tEnd time, and it will find lowest and highest closed prices within datetime on the current chart. I required box will draw the lowest closed and highest closed prices based on M5 TF.
In M5 Lowest candle close 1.08974 and Highest closing price 1.09963
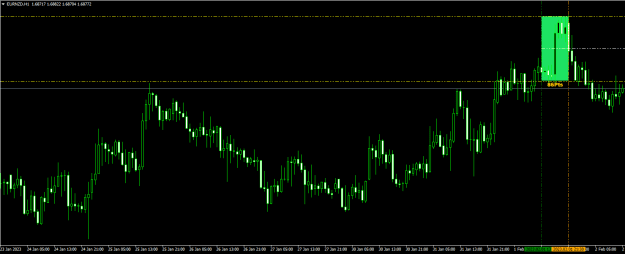
In M15 Lowest candle close 1.08992 and Highest closing price 1.09958
In M30 Lowest candle close 1.09032 and Highest closing price 1.09926
price values will change when i shift higher TF, it must show price values based on M5 within datetime.
FYR please see attached video.
Attached File(s)