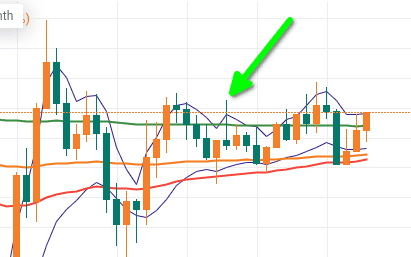
• Home
  • Forums
  • News
  • Calendar
  • Coins
  • Market
  • Login
  • Join
  • User/Email: Password:
  • 2:57pm
Menu
  • Forums
  • News
  • Calendar
  • Coins
  • Market
  • Login
  • Join
  • 2:57pm
Sister Sites
  • Metals Mine
  • Energy EXCH
  • Forex Factory

Options

Bookmark Thread

First Page First Unread Last Page Last Post

Print Thread

Similar Threads

Most Volatile & Crazy Month? 6 replies

Anyone try using XAU/USD - XAU/EUR as proxy for EUR/USD? 4 replies

The most volatile pairs? 5 replies

the most volatile instrument 4 replies

Most volatile over the long term? 0 replies

  • Interactive Trading
  • /
  • Reply to Thread
  • Subscribe
  • 449
Attachments: Most volatile EU/GU/XAU/BTC trading
Exit Attachments

Most volatile EU/GU/XAU/BTC trading

  • Last Post
  •  
  • 1 5051Page 525354 55
  • 1 51Page 5253 55
  •  
  • Post #1,021
  • Quote
  • Jun 13, 2022 7:18am Jun 13, 2022 7:18am
  •  RickM
  • Joined Sep 2015 | Status: Member | 1,860 Posts
Quoting ntk
Disliked
{quote} thank you for the lesson. I just realize now that you trade scalping under M1, and you are not even used MT4,so your delta could not be similiar or even how close to the Tickvolume_separated. very aggressive very professional. totally diffferent to what we learn from babypips or usual MT4 forum. I dont have this future data, so I have no hope to learn from you, or understand your technique, but could you help with posting current chart of US30 & EU today or M15, M5, M1, current. Hence I trade H4, H1, M15, to M5 lowest only, I would like...
Ignored
Hi ntk

Wow, so much information, you deserve a medal if you can make sense of all that data.

I believe the human mind can only focus on sets of data at once - unless your'e a woman of course.

This is the Dow M15 from Friday through to now. What it shows is if you weren't selling the M15- you have rocks in your head.

The key to this chart if you choose to trade delta is - ONLY TRADE ON HIGH VOLUME =around 2,000 units per minute.
Over 500 units per minute is tradable as well but only on smaller timeframes.
Attached Image (click to enlarge)
Click to Enlarge

Name: ymm22.png
Size: 31 KB
Trading thin liquidity at the boundary of the charts
 
5
  • Post #1,022
  • Quote
  • Jun 13, 2022 8:17am Jun 13, 2022 8:17am
  •  ntk
  • Joined Dec 2018 | Status: Member | 954 Posts
Quoting RickM
Disliked
{quote} Hi ntk Wow, so much information, you deserve a medal if you can make sense of all that data. I believe the human mind can only focus on sets of data at once - unless your'e a woman of course. This is the Dow M15 from Friday through to now. What it shows is if you weren't selling the M15- you have rocks in your head. The key to this chart if you choose to trade delta is - ONLY TRADE ON HIGH VOLUME =around 2,000 units per minute. Over 500 units per minute is tradable as well but only on smaller timeframes. {image}
Ignored
you can call it paranoid but for me MM can pull out a hat trick at anytime to pull price back to 200ema even to 800ema like V shape just to hunt SL since it is not so simple to stay Sell since Fri on M15
http://forex.timezoneconverter.com/
 
1
  • Post #1,023
  • Quote
  • Jun 13, 2022 9:18am Jun 13, 2022 9:18am
  •  ryuryu
  • Joined Apr 2020 | Status: Member | 1,514 Posts
Quoting ntk
Disliked
{quote} you can call it paranoid but for me MM can pull out a hat trick at anytime to pull price back to 200ema even to 800ema like V shape just to hunt SL since it is not so simple to stay Sell since Fri on M15
Ignored
Money makes the world go round. Market orders move the market.
No one will spend money to push the price to ema200 or draw candlestick patterns.
They analyze the trades and calculate where stops are. Then push the price in that directions when a) enough liquidity will be found there and b) it will be cheap to push the price and start stop cascades to help then push it higher/lower for free.

Also: forget about TFs. All that 15m/1h exist only if your head. We can calculate everything based on some range, but it is just to have some start and end points. When we trade volume there are no timeframe. Only volume, speed, delta and distance.
Observer effect
1
5
  • Post #1,024
  • Quote
  • Jun 13, 2022 9:26am Jun 13, 2022 9:26am
  •  RickM
  • Joined Sep 2015 | Status: Member | 1,860 Posts
Quoting ntk
Disliked
{quote} you can call it paranoid but for me MM can pull out a hat trick at anytime to pull price back to 200ema even to 800ema like V shape just to hunt SL since it is not so simple to stay Sell since Fri on M15
Ignored
Did you look at the bloody delta.

It was mainly sellers during the run down.

Volume was increasing, delta red = +90 chance of winning. If we have the M1 chart up to look for warning signs , we don't need to worry.
If the delta flips on M5 while trading M15, now its time to THINK
Trading thin liquidity at the boundary of the charts
 
5
  • Post #1,025
  • Quote
  • Jun 13, 2022 9:30am Jun 13, 2022 9:30am
  •  ntk
  • Joined Dec 2018 | Status: Member | 954 Posts
Quoting ryuryu
Disliked
{quote} Money makes the world go round. Market orders move the market. No one will spend money to push the price to ema200 or draw candlestick patterns. They analyze the trades and calculate where stops are. Then push the price in that directions when a) enough liquidity will be found there and b) it will be cheap to push the price and start stop cascades to help then push it higher/lower for free. Also: forget about TFs. All that 15m/1h exist only if your head. We can calculate everything based on some range, but it is just to have some start and...
Ignored
Yes ranges targets levels they call them ... issues is which levels first no way to see
So you also use volume data, with delta and such, no TF etc like rickM

look at gold and UJ ....
http://forex.timezoneconverter.com/
 
1
  • Post #1,026
  • Quote
  • Jun 13, 2022 9:36am Jun 13, 2022 9:36am
  •  RickM
  • Joined Sep 2015 | Status: Member | 1,860 Posts
Quoting ryuryu
Disliked
{quote} Money makes the world go round. Market orders move the market. No one will spend money to push the price to ema200 or draw candlestick patterns. They analyze the trades and calculate where stops are. Then push the price in that directions when a) enough liquidity will be found there and b) it will be cheap to push the price and start stop cascades to help then push it higher/lower for free. Also: forget about TFs. All that 15m/1h exist only if your head. We can calculate everything based on some range, but it is just to have some start and...
Ignored
Totally agree Ryuryu

When we trade volume there are no timeframe. Only volume, speed, delta and distance.
Trading thin liquidity at the boundary of the charts
 
6
  • Post #1,027
  • Quote
  • Jun 13, 2022 10:10am Jun 13, 2022 10:10am
  •  ryuryu
  • Joined Apr 2020 | Status: Member | 1,514 Posts
Quoting ntk
Disliked
{quote} Yes ranges targets levels they call them ... issues is which levels first no way to see So you also use volume data, with delta and such, no TF etc like rickM look at gold and UJ ....
Ignored
Let me explain why it is hard to show volume trading using timeframe and historical data.

Attached Image (click to enlarge)
Click to Enlarge

Name: screenshot.png
Size: 7 KB

Take a look at this candle. Close of that candle lower than open, so it is bear candle. It closed inside ema3 high and ema10 low. And it has positive delta.

But. In real life it was not that way. It was higher the ema3 high and the delta was negative. My bot immediately placed limit sell order, it was filled and immediately placed sell buy at the distance range ema3 - ema10 / 4.

That trade last 2 seconds and gained about 0.35%
Attached Image (click to enlarge)
Click to Enlarge

Name: screenshot.png
Size: 5 KB

Now how to explain it with historical charts? You must record video then to show how it was in real time.
Observer effect
1
3
  • Post #1,028
  • Quote
  • Jun 13, 2022 11:01am Jun 13, 2022 11:01am
  •  ntk
  • Joined Dec 2018 | Status: Member | 954 Posts
Quoting ryuryu
Disliked
{quote} Let me explain why it is hard to show volume trading using timeframe and historical data. {image} Take a look at this candle. Close of that candle lower than open, so it is bear candle. It closed inside ema3 high and ema10 low. And it has positive delta. But. In real life it was not that way. It was higher the ema3 high and the delta was negative. My bot immediately placed limit sell order, it was filled and immediately placed sell buy at the distance range ema3 - ema10 / 4. That trade last 2 seconds and gained about 0.35%{image} Now how...
Ignored
I understand the important of volume, I understand you very well ryuryu ... and trading with such speed under M1 with no bot near impossible ... so another hurde for me.

it reminds me what happen too the first 2 to 5 secs or the last 2 to 5secs of any TF candle: a fullbody candle could turn into a pin bar, or vice versa ... that is why live trading is hard because on history chart, those behavior disappeared

So your and RickM method rely on these subscription future volume data. It have nothing to do with VSA, or PVA methods

If I dont order this volume data I would not be able to follow, learn or understand your trade result, is it right.
http://forex.timezoneconverter.com/
 
2
  • Post #1,029
  • Quote
  • Jun 13, 2022 11:15am Jun 13, 2022 11:15am
  •  ryuryu
  • Joined Apr 2020 | Status: Member | 1,514 Posts
Quoting ntk
Disliked
{quote} I understand the important of volume, I understand you very well ryuryu ... and trading with such speed under M1 with no bot near impossible ... so another hurde for me. it reminds me what happen too the first 2 to 5 secs or the last 2 to 5secs of any TF candle: a fullbody candle could turn into a pin bar, or vice versa ... that is why live trading is hard because on history chart, those behavior disappeared
Ignored
Yeah, but RickM do it manually, so it is possible

Quoting ntk
Disliked
So your and RickM method rely on these subscription future volume data. It have nothing to do with VSA, or PVA methods If I dont order this volume data I would not be able to follow, learn or understand your trade result, is it right.
Ignored
Sorry, I don't know what VSA and PVA is. I'm not very good at sorts of shit

If you want to trade forex you can buy CME data. So you will check CME real trades, but trade on fake forex. It has lag few milliseconds so it is even very funny to see how all the brokers copy-paste it to draw their fake candles.

To make it you can buy indis for mt4/5, or you can use build-in subscription in MotiveWave, Quantower or Sierra. Just compare what you like more. Personally I don't like em all. Hahaha

If you want to trade crypto then the data is free. All you have to do it to take it from exchange API and use for your bots or manual trading.
Observer effect
1
5
  • Post #1,030
  • Quote
  • Edited at 12:04pm Jun 13, 2022 11:44am | Edited at 12:04pm
  •  ntk
  • Joined Dec 2018 | Status: Member | 954 Posts
Quoting ryuryu
Disliked
{quote} Yeah, but RickM do it manually.
Ignored
trade in sec ... so fast fingers

you are calling my chart fake candle chart!!! How come therre are guys who are very successful trading with only those ... llike 2014Newbies, pat, Kette, etc
Only me need to get more advise because I have not understood enough to trade with consistent profit with those candles

Quoting ryuryu
Disliked
{quote}If you want to trade crypto then the data is free. All you have to do it to take it from exchange API and use for your bots or manual trading.
Ignored
this I did not know. I dont trade crpto but I will do research. ppl must use different platform than MT4 to get the volume data, how do you know?
http://forex.timezoneconverter.com/
 
 
  • Post #1,031
  • Quote
  • Jun 13, 2022 12:39pm Jun 13, 2022 12:39pm
  •  ntk
  • Joined Dec 2018 | Status: Member | 954 Posts
Quoting ryuryu
Disliked
{quote} Money makes the world go round. Market orders move the market. No one will spend money to push the price to ema200 or draw candlestick patterns. They analyze the trades and calculate where stops are. Then push the price in that directions when a) enough liquidity will be found there and b) it will be cheap to push the price and start stop cascades to help then push it higher/lower for free. Also: forget about TFs. All that 15m/1h exist only if your head. We can calculate everything based on some range, but it is just to have some start and...
Ignored
If you check US30 they just pushed price up to 800ema, let see if in M5 the behavior is consistent or Just a fake move
http://forex.timezoneconverter.com/
 
 
  • Post #1,032
  • Quote
  • Jun 13, 2022 1:19pm Jun 13, 2022 1:19pm
  •  Mcken
  • | Joined Sep 2014 | Status: Member | 18 Posts
What timeframe are you referring to? I don't see US30 anywhere near 800EMA

Quoting ntk
Disliked
{quote} If you check US30 they just pushed price up to 800ema, let see if in M5 the behavior is consistent or Just a fake move
Ignored
 
 
  • Post #1,033
  • Quote
  • Jun 13, 2022 1:31pm Jun 13, 2022 1:31pm
  •  ryuryu
  • Joined Apr 2020 | Status: Member | 1,514 Posts
Quoting ntk
Disliked
{quote} If you check US30 they just pushed price up to 800ema, let see if in M5 the behavior is consistent or Just a fake move
Ignored
My friend. If you place 700 ema, 711 ema, 643 ema, 555 ema, 852 ema and any other ema on you chart price will HIT it. For sure.
As I said many times this thread is not about magical thinking. Price hit ema not because someone want it to hit. But because it is just an average price for given period.

To understand what happened on US30 you can just take a look at traded volume. Personally I don't trade it because it make no sense for me due to small distance it moves, spread, fees and margin requirements. I'd better trade crypto, because it is much more profitable.

There are no "fake" moves on the market. Price moves because of market orders. Big players and retail traders hit the market with market orders, they found corresponding limit orders in the orderbook and also trigger stops (they are market orders too), so this cause more limit orders to fill and price moves, taking the liquidity off the market.

If you want to trade with volume first you have to understand the difference between market and limit order, understand what orderbook is and what orderflow is.
It is not very complicated in fact.

Last but not least. Forget about timeframes. They are just time-range. Market works not with timeframes. And it don't care about emas. Market works if there is a liquidity to trade. Only market orders move the market.
Observer effect
1
5
  • Post #1,034
  • Quote
  • Jun 13, 2022 5:35pm Jun 13, 2022 5:35pm
  •  Geester
  • | Joined Jul 2017 | Status: Member | 182 Posts
Quoting RickM
Disliked
{quote} Totally agree Ryuryu When we trade volume there are no timeframe. Only volume, speed, delta and distance.
Ignored
Hey @RickM - where do you obtain your speed and distance values from? Also, if you could clarify these terms, I'd really appreciate it. I image speed is something like the pace of the bids/offers? Not sure about distance though.

Cheers buddy.
 
 
  • Post #1,035
  • Quote
  • Jun 13, 2022 9:49pm Jun 13, 2022 9:49pm
  •  ntk
  • Joined Dec 2018 | Status: Member | 954 Posts
Quoting ryuryu
Disliked
{quote} My friend. If you place 700 ema, 711 ema, 643 ema, 555 ema, 852 ema and any other ema on you chart price will HIT it. For sure. As I said many times this thread is not about magical thinking. Price hit ema not because someone want it to hit. But because it is just an average price for given period. To understand what happened on US30 you can just take a look at traded volume. Personally I don't trade it because it make no sense for me due to small distance it moves, spread, fees and margin requirements. I'd better trade crypto, because it...
Ignored
I dont understand if you left out all ema, TF day, hour, 15 min, 5 min , then how can one trade, like standing before figure 1/?
all time characteristic pattern HOD/LOD, week low week high, month low month high, pivot, SHS, half batman, V shape, harmonic cipher, shark, bat etc. gone so how you trade figure 2/? not with volume sub window because at live time the volume histogram appeared totally different than this at close of candle?
I guess the future volume data provide enough point and leadingly not lagging marks, and if you take a video at the chart screen you would see your volume bar changes (> than 2500), your volume delta provided many clues/positions, that you can set limited buy orders; sell orders along the move XY, and/or YM lines in figures 3/ (this line XYM shape appears when we expect a manipulation or stop hunting or liq grab use TF H4 )
Is there a video made on the relationship price delta of volume, convince traders to drop the TF thinking, and showing the develoment of trading clues along side a characteristic pattern like along the streak XYM?
Attached Images (click to enlarge)
Click to Enlarge

Name: screenshot.png
Size: 20 KB Click to Enlarge

Name: screenshot.png
Size: 20 KB
http://forex.timezoneconverter.com/
 
 
  • Post #1,036
  • Quote
  • Jun 13, 2022 11:04pm Jun 13, 2022 11:04pm
  •  ntk
  • Joined Dec 2018 | Status: Member | 954 Posts
Quoting Mcken
Disliked
What timeframe are you referring to? I don't see US30 anywhere near 800EMA {quote}
Ignored
low, very low TF .... market is fractal ... important changes hence counted for me when happened first at M1, M5
http://forex.timezoneconverter.com/
 
 
  • Post #1,037
  • Quote
  • Jun 13, 2022 11:11pm Jun 13, 2022 11:11pm
  •  ntk
  • Joined Dec 2018 | Status: Member | 954 Posts
Quoting ryuryu
Disliked
{quote} If you want to trade with volume first you have to understand the difference between market and limit order, understand what orderbook is and what orderflow is.
It is not very complicated in fact.
Ignored
I am not sure about understand the hint you given advise. I do use limit/stop order, SL/TP, order block, order flow, supply demand etc. a lot, every day. maybe not so deep in theory for discussion, but I do use
http://forex.timezoneconverter.com/
 
 
  • Post #1,038
  • Quote
  • Jun 13, 2022 11:30pm Jun 13, 2022 11:30pm
  •  RickM
  • Joined Sep 2015 | Status: Member | 1,860 Posts
Quoting Geester
Disliked
{quote} Hey @RickM - where do you obtain your speed and distance values from? Also, if you could clarify these terms, I'd really appreciate it. I image speed is something like the pace of the bids/offers? Not sure about distance though. Cheers buddy.
Ignored
Hi Geester

Distance is really just the ATR of the candle, basically never trade small candles in a slow market.
Ideally big candles formed by high volume is what we are after - about $100K peer minute in the crypto market.

Extreme speed is normally an indication of STOP orders been triggered in great numbers. Speed of more than 8 times average movement is capitulation of stops.
Trade against that move once delta confirms trade entry.

Its the best trade to take.

Cheers
Trading thin liquidity at the boundary of the charts
 
6
  • Post #1,039
  • Quote
  • Jun 14, 2022 1:17am Jun 14, 2022 1:17am
  •  ryuryu
  • Joined Apr 2020 | Status: Member | 1,514 Posts
Quoting ntk
Disliked
{quote} I dont understand if you left out all ema, TF day, hour, 15 min, 5 min , then how can one trade, like standing before figure 1/? all time characteristic pattern HOD/LOD
Ignored
I don't know what HOD/LOD is.

Quoting ntk
Disliked
SHS, half batman, V shape, harmonic cipher, shark, bat
Ignored
I don't know what half batman or even 1/3 of batman means.

Quoting ntk
Disliked
orders along the move XY, and/or YM lines in figures 3/ (this line XYM shape appears when we expect a manipulation or stop hunting or liq grab use TF H4 ) Is there a video made on the relationship price delta of volume, convince traders to drop the TF thinking, and showing the develoment of trading clues along side a characteristic pattern like along the streak XYM?
Ignored
Sorry I didn't get a single word you said. I'm not using bats, cats, sharks, expectations, prays, predictions, magic, hopes and other non-existent things.

Quoting ntk
Disliked
I do use limit/stop order, SL/TP, order block, order flow, supply demand etc. a lot, every day
Ignored
No you are not using order flow, because there are no order flow on forex. You can't use supply and demand too, because there are no orderbook on forex too.

I didn't get why so many useless theory when you can just spend 10$ to get CME volume data or just get free crypto data and take a look at it.
Observer effect
 
3
  • Post #1,040
  • Quote
  • Jun 14, 2022 1:28am Jun 14, 2022 1:28am
  •  ryuryu
  • Joined Apr 2020 | Status: Member | 1,514 Posts
Quoting Geester
Disliked
{quote} Hey @RickM - where do you obtain your speed and distance values from? Also, if you could clarify these terms, I'd really appreciate it. I image speed is something like the pace of the bids/offers? Not sure about distance though. Cheers buddy.
Ignored
Speed is trades per millisecond. If less that 1/100 that is low speed. If more that is good then.
Distance is... I'm using different calculations, just because on tradingview for example is easier to use one, in python another.
I mean that in TV I use ((high-low)/low)*100, but in my trading bots it is (ema6 high * 100 / ema6 low) - 100

I mean that it is not the thing you must stick on it. You can use ATR, or ADR / some. Or distance between emas, or just high/low. Or you can smooth it with ema. It doesn't matter much. It just must be dynamic.
Observer effect
 
3
  • Interactive Trading
  • /
  • Most volatile EU/GU/XAU/BTC trading
  • Reply to Thread
    • 1 5051Page 525354 55
    • 1 51Page 5253 55
1 trader viewing now
  • More
Top of Page
  • Facebook
  • Twitter
About CC
  • Mission
  • Products
  • User Guide
  • Blog
  • Contact
CC Products
  • Forums
  • Calendar
  • News
  • Coins
  • Market
CC Website
  • Homepage
  • Search
  • Members
  • Report a Bug
Follow CC
  • Facebook
  • Twitter

CC Sister Sites:

  • Metals Mine
  • Energy EXCH
  • Forex Factory

Crypto Craft® is a brand of Fair Economy, Inc.

Terms of Service / ©2022