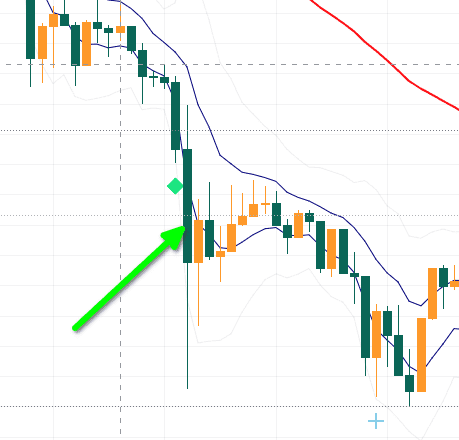
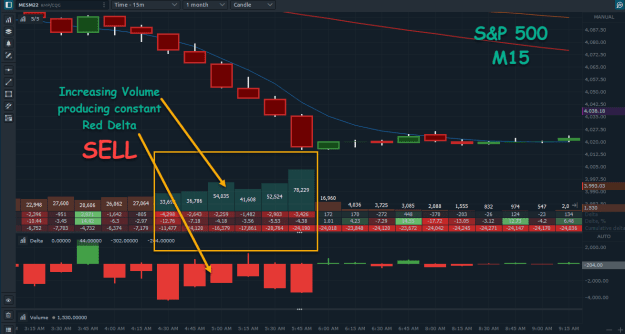
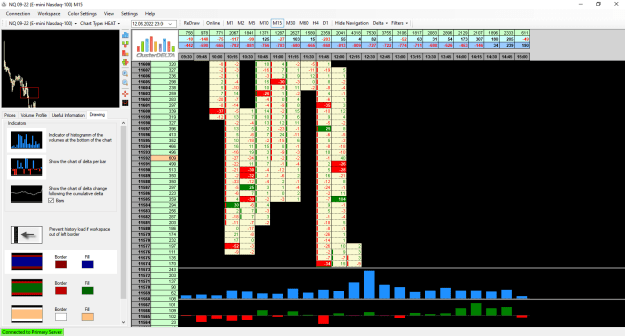
Disliked{quote} Hi Mihajlou As a learning tool for the volume beginner, just jump onto the Futures code for EURUSD and study the relationship between volume and delta, then see the imbalance flip the market with a "thrust candle" moving price bearish or bullish. Then jump onto a Gold chart (Futures) and study Cascading stop runs to learn how the big players move the market for zero cost. BUT To trade with the Footprint charts on fast moving markets is a HEADACHE needing three pills and a stiff drink. It over complicates trading unless you stay with EURUSD....Ignored
 Most volatile EU/GU/XAU/BTC trading
- #1,002
- Jun 10, 2022 9:39am Jun 10, 2022 9:39am
- Joined Sep 2015 | Status: Trader | 2,517 Posts
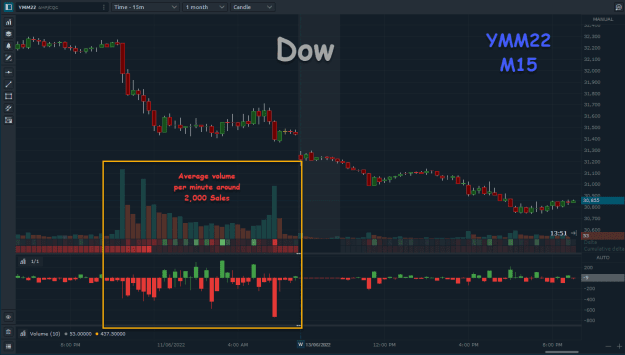
Trading thin liquidity at the boundary of the charts
- #1,004
- Jun 11, 2022 1:46am Jun 11, 2022 1:46am
- Joined Apr 2020 | Status: Trader/Coder | 1,929 Posts
Observer effect
- #1,005
- Jun 11, 2022 3:48am Jun 11, 2022 3:48am
- Joined Sep 2015 | Status: Trader | 2,517 Posts
Trading thin liquidity at the boundary of the charts
- #1,007
- Edited 10:45pm Jun 11, 2022 9:59pm | Edited 10:45pm
- Joined Dec 2018 | Status: Trader | 1,271 Posts
- #1,008
- Jun 12, 2022 3:22am Jun 12, 2022 3:22am
- Joined Apr 2020 | Status: Trader/Coder | 1,929 Posts
Observer effect
- #1,009
- Jun 12, 2022 8:48am Jun 12, 2022 8:48am
- Joined Sep 2015 | Status: Trader | 2,517 Posts
Trading thin liquidity at the boundary of the charts
- #1,010
- Jun 12, 2022 9:06am Jun 12, 2022 9:06am
- Joined Sep 2015 | Status: Trader | 2,517 Posts
Trading thin liquidity at the boundary of the charts
- #1,012
- Edited 8:27pm Jun 12, 2022 8:07pm | Edited 8:27pm
- Joined Sep 2015 | Status: Trader | 2,517 Posts
Trading thin liquidity at the boundary of the charts
- #1,013
- Jun 13, 2022 3:25am Jun 13, 2022 3:25am
- Joined Apr 2020 | Status: Trader/Coder | 1,929 Posts
Observer effect
- #1,017
- Edited 6:04am Jun 13, 2022 5:27am | Edited 6:04am
- Joined Dec 2018 | Status: Trader | 1,271 Posts
- #1,019
- Jun 13, 2022 6:18am Jun 13, 2022 6:18am
- Joined Sep 2015 | Status: Trader | 2,517 Posts
Trading thin liquidity at the boundary of the charts