{quote} Thanks, I will try to read in more detail your topic. Are you trading by buying the cryptocurrencies in real or just trading just the numbers of it?
{quote} do you trade using charts like that or simple candle stick chart without any thing on it?
Ignored
Depends on the market you trade.
Crypto Futures - Always look for short positions on pullbacks and enter when volume gives the signal. Candle stick shapes irrelevant.
DOW / S&P. / NASSY - Use candle shape patterns for the setup but only enter if the move is supported by Delta. When I talk about candle shape, It’s all about Wick Rejection then entering on agreeable Delta confirmation.
Therefore naked candle chart with a seperate Time & Sales window.
Here we are mainly trading Crypto so NO candle patterns, targets or colourful lines please.
Cheers
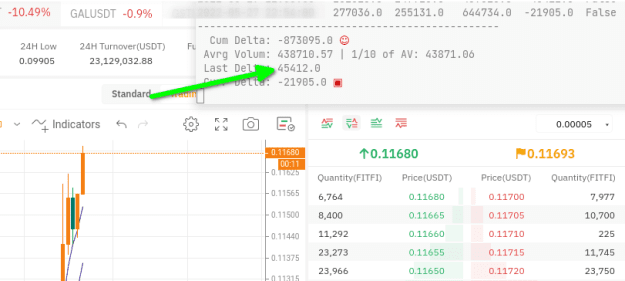
Trading thin liquidity at the boundary of the charts
{quote} Depends on the market you trade. Crypto Futures - Always look for short positions on pullbacks and enter when volume gives the signal. Candle stick shapes irrelevant. DOW / S&P. / NASSY - Use candle shape patterns for the setup but only enter if the move is supported by Delta. When I talk about candle shape, It’s all about Wick Rejection then entering on agreeable Delta confirmation. Therefore naked candle chart with a seperate Time & Sales window. Here we are mainly trading Crypto so NO candle patterns, targets or colourful lines please....
Ignored
About only shorting crypto features, does that depend in the Market condition (bullish/bearish), or it's always only looking for shorts?
{quote} About only shorting crypto features, does that depend in the Market condition (bullish/bearish), or it's always only looking for shorts?
Ignored
Let me answer that Q.
I have million hours of trading stats. And I must say that shorts works better. I started to investigate the reason. The average "distance" on shorts is about 30% wider than on longs.
And I came to conclusion that it is because 99.99% people just don't understand how to short. There are no such a thing like short in real life, so average "trader" can't imagine how it can be.
Ask yourself: do you really understand the shorts mechanics? Do you know the difference how margin works on longs and on shorts? I can bet than 99.99% of you even never heard what I'm talking about.
That's why only shorts. Because as I said many times: since we are traders we must search for better conditions. That's why we are trading crypto: it has wider TP range, smaller fees, great free volume data and very good volatility. It has no sessions and works 24/7 and there are no proprietary software like mt4/5.
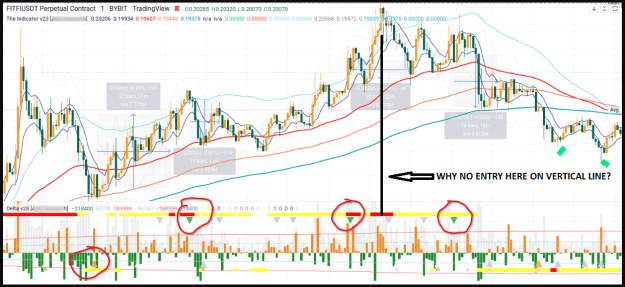
Why no entry where I marked in black with the vertical line?
1) price above EMA6 high --> Yes
2) you have distance from other EMAs --> Yes
3) you have delta flip --> Yes
Maybe because your indicator at the bottom (I'm guessing is volume) is still orange?
@ryuryu Why no entry where I marked in black with the vertical line? 1) price above EMA6 high --> Yes 2) you have distance from other EMAs --> Yes 3) you have delta flip --> Yes Maybe because your indicator at the bottom (I'm guessing is volume) is still orange? Thanks {image}
Ignored
As you see there was gray mark. Marks for short are: dark green, light green, gray and light gray. Best are dark green. The probability is the best. Next is green and so on.
Of course if you wish you can take dark green, green and gray. They are good. But there are so many coins around so there is no need to jump into any signal.
But you right it was very good place to enter, because the distance was very big (red line), the volume was huge. The only thing that was not met is the volume of flip. It is easy to say now that it was good place, in real trading you don't know what will happen next. And you have no time to analyze all the things at once and make your decision. So I prefer just skip such an entries. No regrets if you miss few. You can't earn all the money in the world
{quote} As you see there was gray mark. Marks for short are: dark green, light green, gray and light gray. Best are dark green. The probability is the best. Next is green and so on. Of course if you wish you can take dark green, green and gray. They are good. But there are so many coins around so there is no need to jump into any signal. But you right it was very good place to enter, because the distance was very big (red line), the volume was huge. The only thing that was not met is the volume of flip. It is easy to say now that it was good place,...
Ignored
Thanks @ryuryu for the explanation.
Looking again to the picture at the green signals only --> 3 signals were all winners.
Cheers
Joined Apr 2020
|
Status: Trader/Coder
|1,929 Posts
Let's talk about volume again.
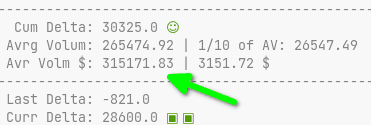
How to check the volume of an asset in $? And why it is important.
How to check: You must multiply average volume on current asset price (ask, or big - doesn't matter much).
For example:
Attached Image (click to enlarge)
GMTUSDT, average volume is 265474, in $ it is 315171$
Why this is important? Because on forex and especially on demo forex you can trade literally billions. Like guys trading 5-10 lots on GU, where 1 lot > 100000$.
In real life everything has its limits.
I prefer trade 1/100 of asset volume. It helps to "hide" your trade. For example on GMT I'll trade with 3150$. If I want to trade 10k, I'll trade on 3 assets at once, or I can trade on several exchanges at once and so on.
So real trading is a little bit more complicated then drawing fancy lines on historical charts and post bullshit with serious faces. Before you start your trading day you have to prepare: make some calculations, filter out what you want to trade and so on.
People ask if it real that 95% of retail traders lose? Ha! Check FF. There are new thread with guy who draw lines in mt4 for 13 years. Of course 95% lose. I'm curious that not 99.9% in this case. Imagine: 13 years of "trading" but zero knowledge of what is the difference between market and limit orders, how market works, how volume affect it. He can't answer simple question how margin calculated. Nothing. Zero. Null. He learned for 13 years only how to draw lines form previous high/low and how to call them support and resistance.
Joined Apr 2020
|
Status: Trader/Coder
|1,929 Posts
The "why" approach and the Truth.
"Why" approach is when before you start to use some (indicator, line) you ask yourself simple question "why?"
For example. Why RSI 14? Why EMA200? Why timeframe is 1 min?
Also, try to criticize everything! EVERYTHING!
Why they call delta the thing that in fact is CUMULATIVE delta for 1 min candle? It is NOT a delta. It is cumulative delta for given period. And so on and so on.
And the Truth: MARKET orders move the market. Always. There is NO OTHER option. Market move not because "traders respect ma 200". Market not moves because of news. It moves because of MARKET orders. And stops are ALWAYS market orders. ALLTHEFWAYS!
Remember it. Write it down and read every day like mantra.
{quote} Depends on the market you trade. Crypto Futures - Always look for short positions on pullbacks and enter when volume gives the signal. Candle stick shapes irrelevant. DOW / S&P. / NASSY - Use candle shape patterns for the setup but only enter if the move is supported by Delta. When I talk about candle shape, It’s all about Wick Rejection then entering on agreeable Delta confirmation. Therefore naked candle chart with a seperate Time & Sales window. Here we are mainly trading Crypto so NO candle patterns, targets or colourful lines please....
Let's talk about volume again. How to check the volume of an asset in $? And why it is important. How to check: You must multiply average volume on current asset price (ask, or big - doesn't matter much). For example: {image} GMTUSDT, average volume is 265474, in $ it is 315171$ Why this is important? Because on forex and especially on demo forex you can trade literally billions. Like guys trading 5-10 lots on GU, where 1 lot > 100000$. In real life everything has its limits. I prefer trade 1/100 of asset volume. It helps to "hide" your trade. For...
Ignored
Are you using this formula? Cumulative Delta: Market Buy Orders – Market Sell Orders
|
Membership Revoked
|
Joined Nov 2020
|2,353 Posts
I use "lines on a chart" however my lines are based on an accumulated knowledge base and time trading, not fantasy trading approaches that have people trying to be schemers instead of invested traders. Once you've learned how to track an asset class/instrument, you don't need to rely on external resources, because you can find the upstream of it. This is why I say stories are a distraction. And why I will continue to use my lines because they're in no way arbitrary or guesses.