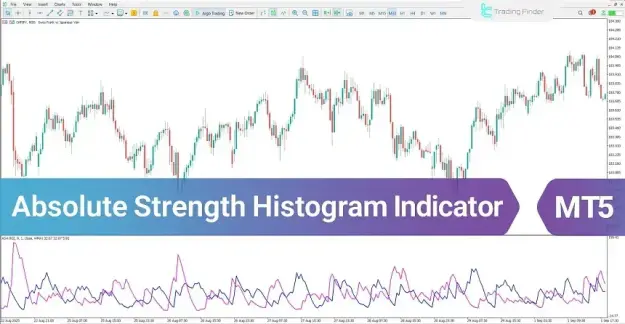


It is presented as a histogram in a separate window, where variations in bar color reflect the dominance of buyers or sellers. Furthermore, crossovers between signal lines provide insight into momentum shifts and indicate the possible start or end of prevailing trends.
 You can download it from this link:
https://cdn.tradingfinder.com/file/5...by-tflab-2.zip
 You can also access the MetaTrader 4 version of this Indicator through this page:
https://www.cryptocraft.com/thread/1...mt4-free-tflab
 For instructions on how to install:
https://www.forexfactory.com/thread/...-in-metatrader
Prop Firm DrawDown Protector : Prop Firm Capital Protection Expert MT5 |Forex Money Management: Forex Trade Management Expert MT5 | ICT Concepts Indicator MT5 |Smart Money Concepts Expert MT5 | Smart Money Trap Scanner | Get a free Expert Advisor license via Telegram and WhatsApp
Indicator Overview and Specifications
The Absolute Strength Histogram Indicator is a widely recognized tool in technical analysis, as it effectively integrates momentum measurement with trend evaluation in a unified structure.
- Classified under oscillator indicators for MetaTrader 5
- Suitable for analyzing currency strength and market momentum
- Fully compatible with the MetaTrader 5 platform
- Appropriate for traders with intermediate trading knowledge
- Designed to detect potential market reversals
- Supports multi-timeframe analysis
- Ideal for intraday trading strategies
- Applicable to multiple asset classes:
- Forex currency pairs
- Cryptocurrencies
- Stocks and equities
- Commodities
- Market indices
Absolute Strength Histogram Indicator at a Glance
This indicator assesses bullish and bearish conditions by combining trend strength analysis with momentum evaluation.
It utilizes histogram bars alongside signal lines to present clear and actionable signals:
- Blue histogram bars represent bullish conditions, indicating stronger buying pressure and a continuation of the upward trend
- Pink histogram bars signify bearish conditions, highlighting increased selling pressure and the persistence of a downward trend
Indicator Behavior in Bullish Conditions
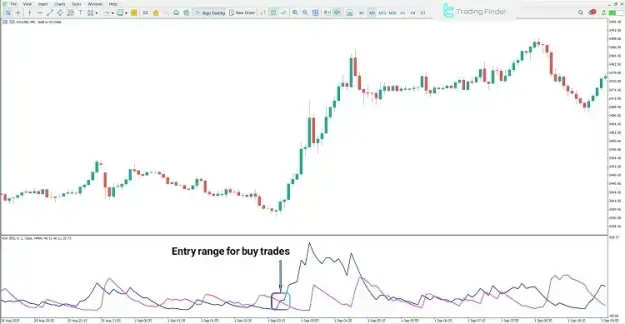
In an upward-trending market, the indicator produces multiple confirming signals that support long (buy) positions.
Key Characteristics
- Blue histogram bars reflect strong buyer dominance
- The bullish signal line positioned above the bearish line confirms upward momentum
- Increasing histogram height indicates strengthening buying pressure
Trading Insight
- The combination of these signals creates favorable conditions for entering buy trades
- Sustained growth in histogram bars suggests continuation of the bullish trend
Indicator Behavior in Bearish Conditions
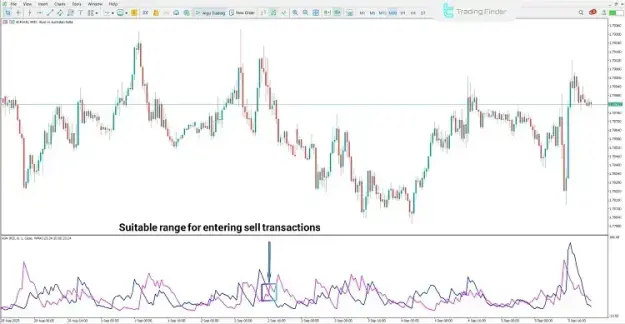
In downward market trends, the indicator shifts to emphasize seller dominance and declining momentum.
Key Characteristics
- Histogram bars change to pink, indicating selling pressure
- Signal line positioning confirms bearish momentum
- Continued expansion of histogram bars reflects increasing downward strength
Trading Insight
- These conditions signal potential opportunities for sell trades
- Persistent bearish signals indicate the likelihood of trend continuation
Absolute Strength Histogram Indicator Settings
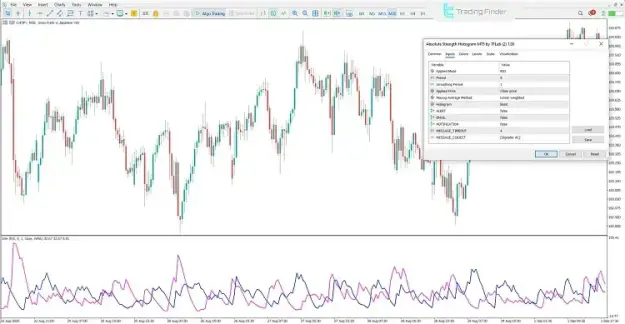
The settings panel provides flexibility, allowing traders to adjust the indicator based on their trading strategy and market environment.
Core Parameters
- Applied Mode: Determines the calculation basis, commonly derived from the Relative Strength Index (RSI)
- Period: Defines the number of candles included in the calculation
- Smoothing Period: Adjusts the degree of data smoothing
- Applied Price: Typically based on the closing price of each candle
- Moving Average Method: Often set to Linear Weighted Moving Average (LWMA)
- Histogram Type: Specifies the style of histogram visualization
- Mode_Histo: Controls how the histogram is displayed
Alert and Notification Options
- ALERT: Activates on-screen notifications
- EMAIL: Sends trading signals via email
- NOTIFICATION: Enables platform push notifications
- MESSAGE_TIMEOUT: Sets the duration of alert display
- MESSAGE_SUBJECT: Defines the title of notification messages
Conclusion
The Absolute Strength Histogram Indicator is an advanced technical analysis tool that combines histogram visualization with signal line interactions to measure trend strength and momentum effectively.
Through the interpretation of color changes and signal crossovers, traders can identify high-probability entry and exit points. Its flexibility across different timeframes and asset classes makes it an essential tool for enhancing modern trading strategies.