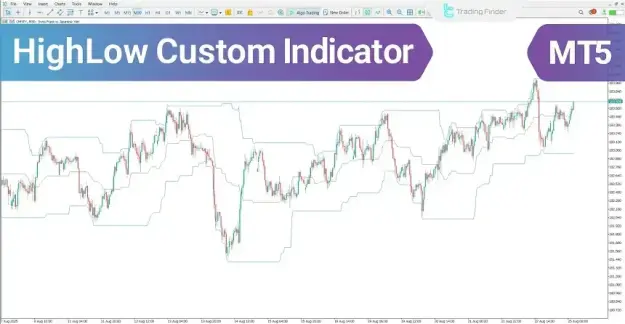


Through the implementation of three dedicated analytical bands, this indicator improves trend assessment and delivers a more precise interpretation of market behavior.
 You can download it from this link:
https://cdn.tradingfinder.com/file/5...5-by-tflab.zip
 You can also access the MetaTrader 4 version of this Indicator through this page:
https://www.cryptocraft.com/thread/1...-download-free
 For instructions on how to install:
https://www.forexfactory.com/thread/...-in-metatrader
Prop Firm DrawDown Protector : Prop Firm Capital Protection Expert MT5 |Forex Money Management: Forex Trade Management Expert MT5 | ICT Concepts Indicator MT5 |Smart Money Concepts Expert MT5 | Smart Money Trap Scanner | Get a free Expert Advisor license via Telegram and WhatsApp
HighLow Custom Indicator Overview
The indicator operates based on three main bands, each designed to analyze price movements from a different perspective:
- Upper Band:
Created by linking recent swing highs, this band serves as a dynamic resistance level and illustrates the intensity of selling pressure in higher price regions. - Lower Band:
Formed by connecting recent swing lows, this band functions as dynamic support and highlights zones where buying interest is likely to increase. - Middle Band:
Derived from the average of recent highs and lows, this band represents the market’s equilibrium level and indicates the balance between supply and demand.
Indicator Performance in an Uptrend
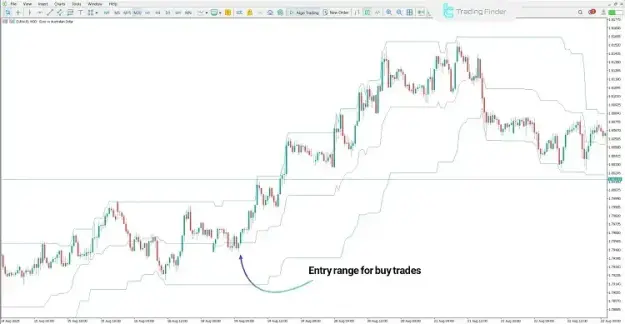
Under bullish market conditions, the indicator provides actionable insights into price behavior:
- Price reactions from the lower band signal strong buying interest.
- Sustained movement above the middle band confirms strengthening bullish momentum.
- This configuration often indicates the beginning of a new upward trend.
- The region near the lower band can serve as an optimal entry point for buy trades.
Indicator Performance in a Downtrend
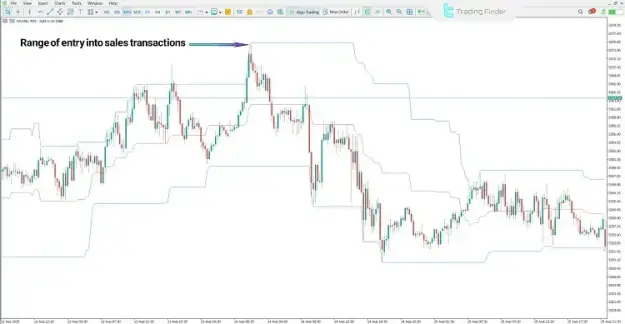
In bearish market environments, the indicator helps identify selling opportunities:
- The upper band acts as a resistance barrier when price approaches it.
- Rejection from this level intensifies selling pressure.
- Price consolidation below the middle band confirms bearish control.
- These conditions support the continuation of the downward trend and define potential entry zones for sell positions.
HighLow Custom Indicator Settings
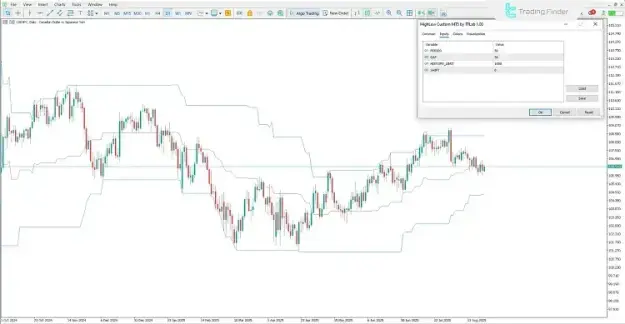
The indicator offers customizable parameters to adapt to different trading styles and market conditions:
- PERIOD:
Specifies the calculation interval used to determine highs and lows. - GAP:
Adjusts the distance between the bands, allowing sensitivity tuning. - HISTORY_LIMIT:
Determines the number of past candles included in the analysis. - SHIFT:
Controls the horizontal positioning of the indicator on the chart.
Key Features and Applications
- Identification of dynamic support and resistance zones
- Recognition of breakout and reversal signals
- Compatibility with multi-timeframe analysis
- Usable across multiple financial markets:
- Forex
- Cryptocurrencies
- Equities
- Suitable for intraday trading strategies
- Improves price action analysis through structured band representation
Conclusion
The HighLow Custom Indicator is a practical and reliable tool for analyzing market trends based on price highs and lows. By generating adaptive support and resistance levels, it enables traders to accurately evaluate trend direction, anticipate reversals, and validate breakout movements.
Its three-band structure provides a clear and organized framework for market analysis, making it an effective solution for both novice and experienced traders.