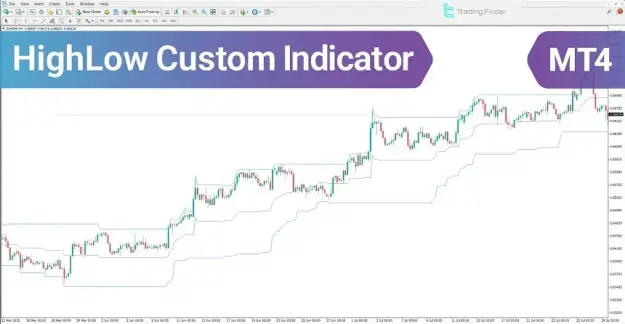


HighLow Custom Indicator Overview
The HighLow Custom Indicator is categorized among practical trading tools used to detect dynamic support and resistance levels across various financial markets. It is fully compatible with the MetaTrader 4 platform and is suitable for traders with elementary to intermediate levels of experience.
 You can download it from this link:
https://cdn.tradingfinder.com/file/5...4-by-tflab.zip
 You can also access the MetaTrader 5 version of this Indicator through this page:
https://www.cryptocraft.com/thread/1...or-mt5-downloa
 For instructions on how to install:
https://www.forexfactory.com/thread/...-in-metatrader
Prop Firm DrawDown Protector : Prop Firm Capital Protection Expert MT4 | Forex Money Management: Forex Trade Management Expert MT4 |ICT Concepts Indicator MT4 | Smart Money Concepts Expert MT4| Smart Money Trap Scanner | Get a free Expert Advisor license via Telegram and WhatsApp
Key Features
- Classified as a support and resistance indicator
- Operates as a trading assistance tool
- Incorporates bands and channels for price structure evaluation
- Supports multi-timeframe analysis
- Suitable for intraday trading strategies
- Applicable across multiple financial instruments, including:
- Forex
- Cryptocurrencies
- Stock markets
- Designed to detect both breakout and reversal signals
Structure of the HighLow Custom Indicator
The HighLow Custom Indicator is composed of three primary bands, each serving a distinct purpose in analyzing price movements:
Upper Band
- Connects recent market highs
- Functions as a dynamic resistance level
- Identifies zones of increased selling pressure
- Indicates potential reversal areas near price ceilings
Lower Band
- Connects recent market lows
- Acts as a dynamic support level
- Reflects strong demand and buyer activity
- Highlights potential zones for bullish reversals
Middle Band
- Represents the average of price highs and lows
- Defines the equilibrium level of the market
- Serves as a reference point for confirming trend direction
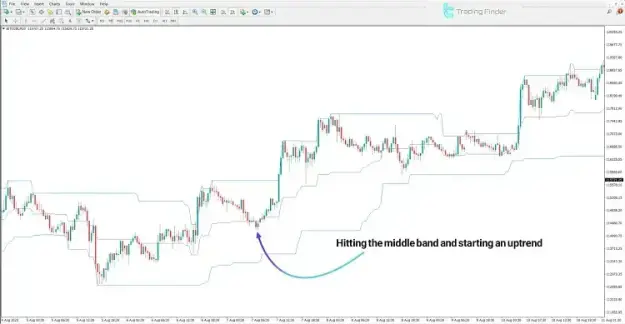
Indicator Behavior in an Uptrend
Under bullish market conditions, the HighLow Custom Indicator provides clear signals for identifying favorable entry opportunities:
- Price tends to react positively when approaching the lower band
- Stability above the middle band confirms the strength of buyers
- The lower band acts as a support level for trend continuation
- These signals collectively indicate potential buy opportunities
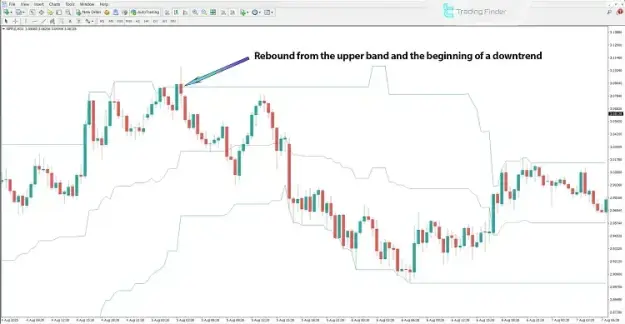
Indicator Behavior in a Downtrend
In bearish market environments, the indicator highlights conditions suitable for sell positions and trend continuation:
- Price interaction with the upper band often results in selling pressure
- The upper band serves as a resistance level
- A move below the middle band confirms seller dominance
- Continued consolidation below the middle band suggests ongoing downward momentum
- These factors indicate appropriate zones for sell entries
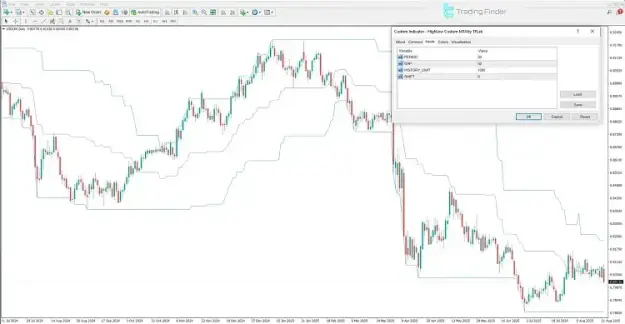
HighLow Custom Indicator Settings
The settings panel of the HighLow Custom Indicator in MetaTrader 4 includes the following adjustable parameters:
- PERIOD
- Defines the calculation period for analyzing highs and lows
- GAP
- Adjusts the spacing between bands to control sensitivity
- HISTORY_LIMIT
- Determines the number of historical candles used in calculations
- SHIFT
- Controls the horizontal displacement of the indicator
Conclusion
The HighLow Custom Indicator is a precise and practical tool in technical analysis, designed to identify dynamic support and resistance zones and evaluate price movements effectively. By systematically linking recent highs and lows, it provides a structured approach to understanding market behavior.
Its capability to detect reversal zones, confirm trend direction, and identify breakout opportunities makes it a valuable addition to trading strategies in Forex, cryptocurrency, and stock markets.