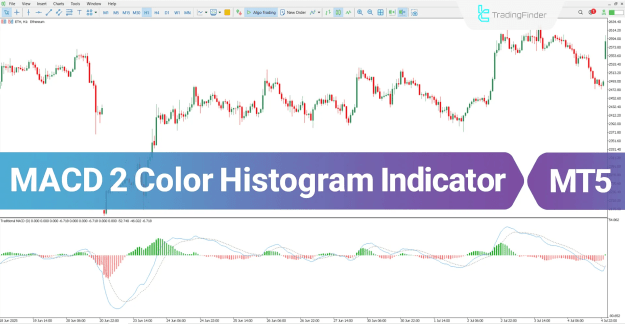


Green bars indicate strengthening bullish pressure, while red bars represent weakening bullish sentiment or growing bearish momentum. This visual representation allows traders to assess trend strength and reversals with improved accuracy.
 You can download it from this link:
https://cdn.tradingfinder.com/file/5...5-by-tflab.zip
 You can also access the MetaTrader 4 version of this Indicator through this page:
https://www.cryptocraft.com/thread/1...-indicator-mt4
 For instructions on how to install:
https://www.forexfactory.com/thread/...-in-metatrader
Prop Firm DrawDown Protector : Prop Firm Capital Protection Expert MT5 |Forex Money Management: Forex Trade Management Expert MT5 | ICT Concepts Indicator MT5 |Smart Money Concepts Expert MT5 | Smart Money Trap Scanner | Get a free Expert Advisor license via Telegram and WhatsApp
Overview of the MACD 2 Color Histogram Indicator
The indicator belongs to several primary categories within MetaTrader 5, including:
- Oscillators MT5 Indicators
- Signal & Forecast MT5 Indicators
- Currency Strength MT5 Indicators
It is compatible with MetaTrader 5 and suitable for different trading approaches:
- Skill Level: Beginner to Intermediate
- Indicator Type: Reversal / Momentum Oscillator
- Timeframe: Multi-Timeframe Supported
- Trading Styles: Swing, Scalping, and Day Trading
- Applicable Markets: Forex, Crypto, and Stocks
How the MACD 2 Color Histogram Works
The indicator generates signals by analyzing the interaction between the MACD line and the signal line.
- When the MACD line crosses above the signal line, a bullish signal is formed, suggesting potential upward momentum.
- When the MACD line crosses below, it signals bearish strength and potential downside movement.
The histogram automatically updates its color in response to these crossovers, providing immediate insight into momentum shifts.
Buy Trade Example
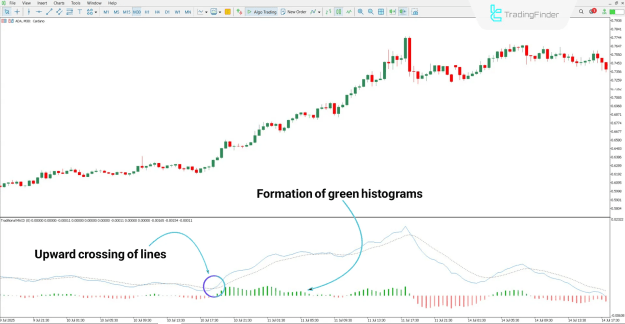
In a 30-minute Cardano (ADA) chart, when the MACD line rises above the signal line, a buy signal is triggered.
The subsequent appearance and expansion of green histogram bars confirm increasing bullish momentum and validate the upward trend continuation.
Sell Trade Example
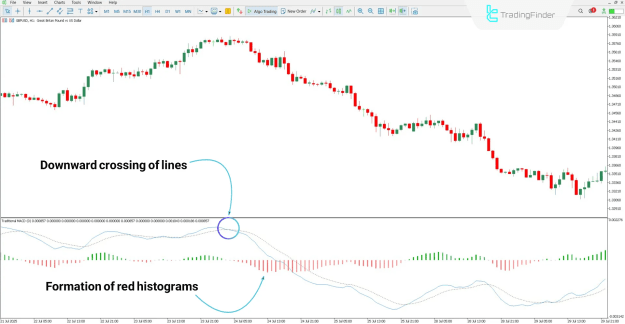
On a 1-hour GBP/USD chart, a downward crossover of the MACD line below the signal line acts as a sell entry signal.
The development of red histogram bars confirms sustained bearish momentum and ongoing selling pressure.
MACD 2 Color Histogram Indicator Settings
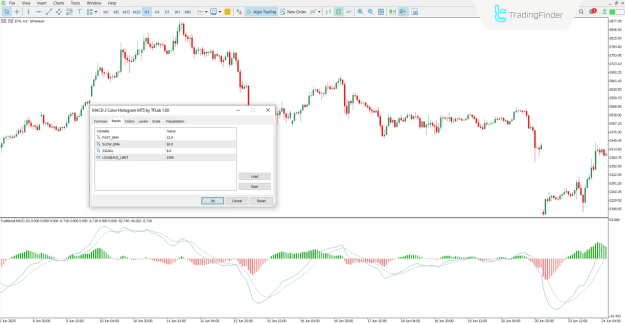
This indicator provides adjustable parameters that allow traders to fine-tune its responsiveness to various market conditions:
- FAST_EMA: Defines the short-term exponential moving average.
- SLOW_EMA: Controls the long-term exponential moving average.
- SIGNAL: Determines the signal line’s smoothing period.
- LOOKBACK_LIMIT: Specifies the visible historical range for analysis.
These options make the tool adaptable to diverse trading instruments and timeframes.
Conclusion
The MACD 2 Color Histogram Indicator refines the classic MACD approach by using color-coded histograms to highlight momentum transitions with clarity and precision.
It allows traders to identify reliable entry and exit points, distinguish between true and false trend shifts, and optimize strategy execution.
Highly customizable and suitable for multiple trading styles, this indicator is an essential addition for traders seeking accurate momentum evaluation and visual confirmation of trend direction on the MetaTrader 5 platform.