https://cdn.tradingfinder.com/file/5...4-by-tflab.zip
https://www.cryptocraft.com/thread/1...icator-for-mt5
https://www.forexfactory.com/thread/...-in-metatrader
Prop Firm DrawDown Protector : Prop Firm Capital Protection Expert MT4 | Forex Money Management: Forex Trade Management Expert MT4 |ICT Concepts Indicator MT4 | Smart Money Concepts Expert MT4| Smart Money Trap Scanner | Get a free Expert Advisor license via Telegram and WhatsApp
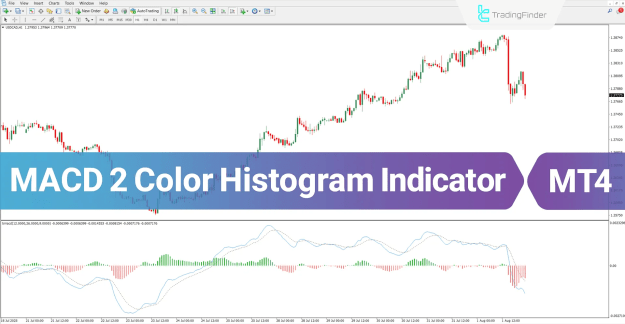
MACD 2 Color Histogram Oscillator Overview
This indicator falls into several key analytical categories, making it a versatile tool for various trading styles and instruments.
- Indicator Categories: Oscillators, Signal & Forecast, and Currency Strength indicators.
- Compatible Platform: MetaTrader 4.
- Recommended Skill Level: Elementary.
- Indicator Type: Reversal signals.
- Timeframe Application: Multi-Timeframe analysis.
- Suitable Trading Styles: Day Trading, Scalping, and Swing Trading.
- Trading Instruments: Effective for Forex, Cryptocurrency, and Stock Market analysis.
The core trading signals generated by the MACD 2 Color Histogram oscillator are derived from the classic crossover between the MACD line and its signal line. An upward crossover suggests a buying opportunity, whereas a downward crossover indicates a potential selling opportunity.
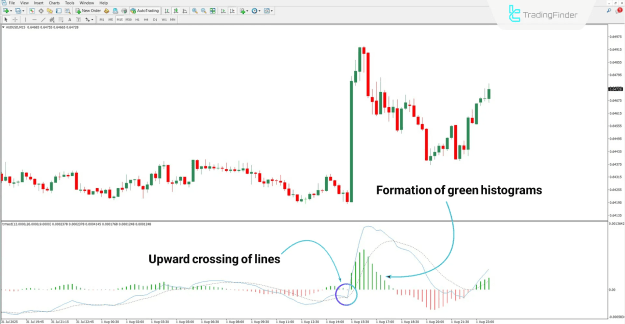
Executing a Buy Trade with the MACD 2 Color Histogram
Identifying Bullish Momentum and Entry Points
An example from a 15-minute chart of the Australian Dollar to US Dollar (AUD/USD) pair illustrates a classic buy signal. An upward crossover, where the MACD line moves above the signal line, represents a suitable entry point for a long position. The simultaneous formation of green histograms confirms and reinforces the strength of the ongoing bullish momentum, providing added conviction for the trade.
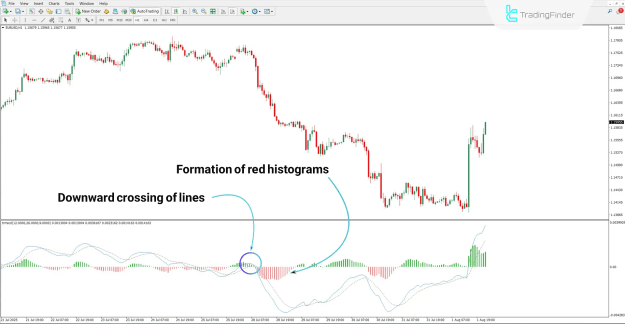
Executing a Sell Trade with the MACD 2 Color Histogram
Recognizing Bearish Trends for Sell Entries
Conversely, on a 1-hour chart for the EUR/USD pair, a identified downward crossover point is interpreted as a sell entry signal. This bearish signal is further validated by the consecutive formation of red histograms. As long as these red bars continue to appear, it suggests that the bearish trend is likely to persist, offering a clear visual cue to remain in or add to a short position.
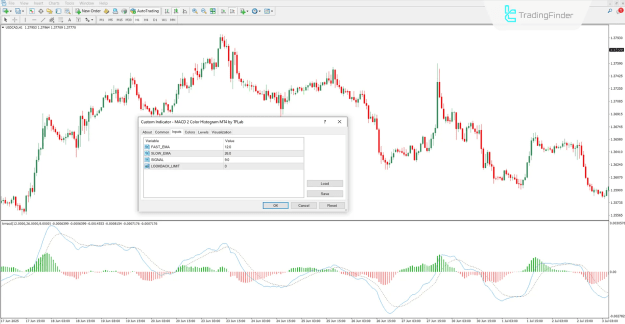
Configuring the MACD 2 Color Histogram Indicator
The functionality of the MACD 2 Color Histogram oscillator can be customized through its settings to suit individual trading preferences. The key adjustable parameters include:
- FAST_EMA: This setting controls the period used for calculating the fast Exponential Moving Average.
- SLOW_EMA: This parameter defines the period for the slow Exponential Moving Average calculation.
- SIGNAL: This value sets the period for the Exponential Moving Average applied to the MACD line, which creates the signal line.
- LOOKBACK_LIMIT: This parameter acts as a limiter, defining the historical lookback range for the indicator's display and calculations.
Conclusion
The MACD 2 Color Histogram oscillator is an effective tool for identifying market momentum and potential reversal points. Through its intuitive color-coded histograms, it visually represents the strength and direction of the prevailing trend—bullish or bearish. Furthermore, the crossover signals between the MACD line and the signal line provide clear entry points for both buy and sell trades. The added flexibility of customizable parameters for the fast, slow, and signal moving averages allows traders to fine-tune the indicator to their specific strategy and the unique characteristics of their chosen market.