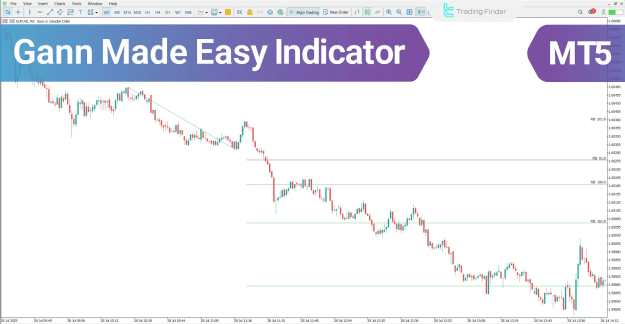


These crucial levels encompass optimal entry zones, predefined price targets (take-profit levels), and essential stop-loss levels. These calculations are based on the synergistic logic of time and price as defined by W.D. Gann's theoretical framework.
Furthermore, trading signals are visually communicated through distinct colored arrows when a validated trading setup is formed.
 You can download it from this link:
https://cdn.tradingfinder.com/file/5...5-by-tflab.zip
 You can also access the MetaTrader 4 version of this Indicator through this page:
https://www.cryptocraft.com/thread/1...oad-free-tflab
 For instructions on how to install:
https://www.forexfactory.com/thread/...-in-metatrader
Prop Firm DrawDown Protector : Prop Firm Capital Protection Expert MT5 |Forex Money Management: Forex Trade Management Expert MT5 | ICT Concepts Indicator MT5 |Smart Money Concepts Expert MT5 | Smart Money Trap Scanner | Get a free Expert Advisor license via Telegram and WhatsApp
Gann Made Easy Indicator Overview
The Gann Made Easy indicator operates by first automatically analyzing significant market highs and lows to accurately determine the prevailing market direction or trend. Subsequently, it leverages classic Gann angles, such as the $1:1$ and $2:1$ ratios, to precisely calculate the aforementioned key price levels. These levels, including entry zones, profit targets, and stop-loss areas, are then displayed graphically on the chart for immediate application.
- When market conditions align with the indicator's defined structural criteria, an entry signal is immediately triggered.
- This signal is conveyed through colored arrows: a green arrow indicates a buy signal, and a red arrow signifies a sell signal.
Indicator in an Uptrend
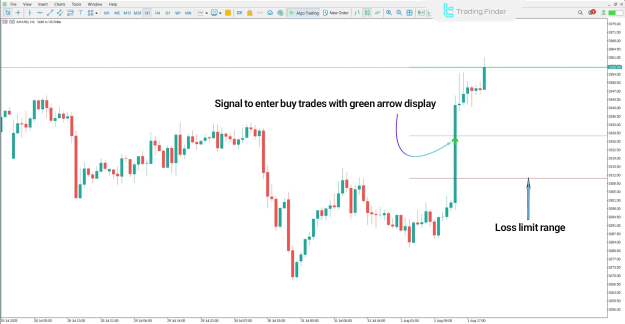
Consider an analysis of Gold Spot (XAU/USD) on a 1-hour timeframe. In the context of an established uptrend:
- The indicator identifies the entry signal by displaying a green arrow when the price successfully breaks above a calculated resistance level.
- The stop-loss level is strategically positioned slightly below the most recent market low.
- Price targets (take-profit levels) are dynamically drawn at higher levels, deriving their placement from the underlying Gann angle structures.
Gann Made Easy Indicator in Uptrend Analysis
Uptrend analysis using the Gann Made Easy tool on MetaTrader 5 (MT5) facilitates precise trade management.
Indicator in a Downtrend
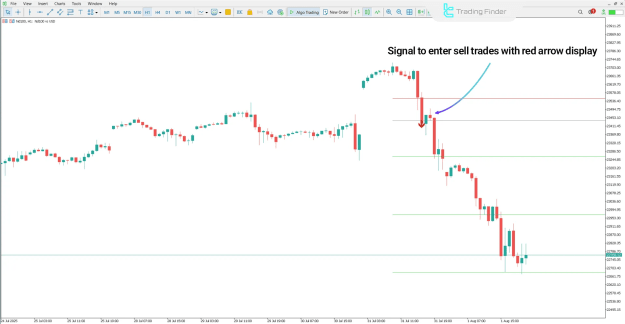
Analyzing an instrument like the Nasdaq 100 (ND100) on a 1-hour timeframe illustrates its application in a downtrend:
- The sell signal is generated and appears as a red arrow on the chart when the price breaks below a designated support level.
- The stop-loss is set marginally above the last significant price high, a measure to maintain trade risk within acceptable parameters.
- Concurrently, the indicator pinpoints potential target levels below the entry point, providing a clear visual representation of the probable price path and effective profit-taking zones.
Gann Made Easy Indicator Settings
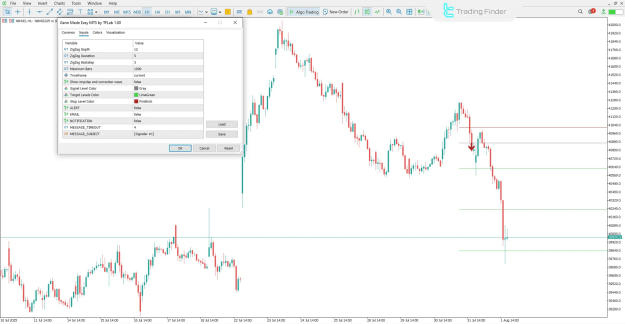
The configuration parameters for the Gann Made Easy indicator provide customization for various trading approaches:
- ZigZag Depth: Defines the minimum vertical price change required.
- ZigZag Deviation: Specifies the minimum number of bars to be considered.
- ZigZag Backstep: Sets the minimum number of bars between consecutive highs and lows.
- Maximum Bars: Determines the maximum number of historical candles used for calculation.
- Timeframe: Allows selection of the specific chart timeframe.
- Show impulse and correction wave: Toggles the display of impulse and correction phases.
- Signal Level Color: Customizes the color of the entry signal level.
- Target Levels Color: Customizes the color of take-profit price levels.
- Stop Level Color: Customizes the color of the stop-loss level.
- ALERT: Enables on-screen trading alerts.
- EMAIL: Activates sending alerts via email.
- NOTIFICATION: Enables mobile notifications.
- MESSAGE TIMEOUT: Sets the delay period between successive alert messages.
- MESSAGE SUBJECT: Defines the subject line for alert messages.
Conclusion
The Gann Made Easy indicator functions by first automatically detecting price highs and lows to reliably identify the prevailing market trend and determine optimal entry zones. Utilizing Gann's proprietary analytical angles, this advanced trading tool then automatically plots both take-profit and stop-loss levels directly onto the chart, providing a complete and simplified trading solution.