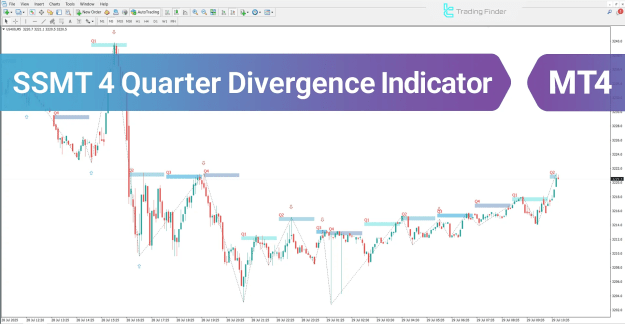
By employing precise temporal and structural analysis, the indicator identifies divergence between correlated assets within the four quarterly timeframes (Q1–Q4).
https://cdn.tradingfinder.com/file/4...4-by-tflab.zip
https://www.cryptocraft.com/thread/1...icator-for-mt5
https://www.forexfactory.com/thread/...-in-metatrader
Prop Firm DrawDown Protector : Prop Firm Capital Protection Expert MT4 | Forex Money Management: Forex Trade Management Expert MT4 |ICT Concepts Indicator MT4 | Smart Money Concepts Expert MT4| Smart Money Trap Scanner | Get a free Expert Advisor license via Telegram and WhatsApp
Core Functionality and Concept
The SSMT 4 Quarter Divergence Indicator functions by analyzing the relationship between two correlated assets, such as NQ100 and US400.
This correlation is fundamental to generating accurate divergence signals and determining potential market reversal zones with precision.
Key Specifications of the SSMT 4 Quarter Divergence Indicator
- Indicator Categories: ICT Indicators, Smart Money Indicators, Trading Assist Indicators
- Platform Compatibility: MetaTrader 4 (MT4)
- Skill Level Required: Advanced Traders
- Indicator Type: Reversal Indicator
- Timeframe Coverage: Multi-Timeframe
- Trading Style: Intraday Trading
- Applicable Markets: Stocks, Forex, and Cryptocurrencies
Overview of the SSMT 4 Quarter Divergence Indicator
The SSMT 4 Quarter Divergence Indicator identifies phase-shift zones by detecting structural divergence between correlated assets and synchronizing those shifts with market time cycles.
When divergence appears during quarterly transitions, it often signals an increased probability of smart money entry or trend reversal.
Final confirmation occurs through the formation of pivot points and market structure breaks in lower timeframes, offering precise entry points in premium or discount zones.
Signal Representation:
 Blue arrows: Indicate bullish divergence or buy signals
 Red arrows: Indicate bearish divergence or sell signals
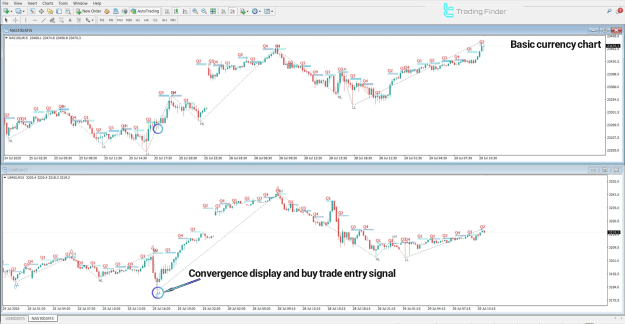
SSMT 4 Quarter Divergence in Bullish Trend
In a bullish scenario, the SSMT Indicator identifies time-based divergence between NAS100 and US400 within the 5-minute timeframe.
- The US400 index breaks its previous swing low, while NAS100 remains structurally stable.
- This asymmetry suggests that smart money is actively absorbing selling pressure.
- Once a bullish candlestick and a structure break confirm the reversal on a lower timeframe, optimal buy opportunities are formed — marked by the blue arrow.
Bullish Trend Insight
This setup highlights the early stages of institutional accumulation, signaling the onset of a bullish market phase and offering strategic entry zones aligned with smart money positioning.
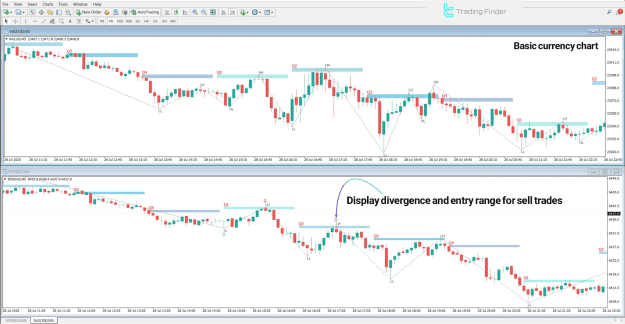
SSMT 4 Quarter Divergence in Bearish Trend
In a bearish setup, divergence develops between the Nasdaq 100 and the S&P 500 when:
- The S&P 500 breaks the previous quarter’s swing high,
- But the Nasdaq 100 fails to confirm the same structural movement.
This inconsistency reflects weakening buying momentum and smart money distribution.
Upon the confirmation of a bearish structure break through a strong downward candlestick, the indicator generates a high-probability short signal, denoted by the red arrow.
Bearish Trend Insight
This phase signifies the gradual exit of institutional positions and the transition into a downward trend, helping traders identify optimal short-entry opportunities.
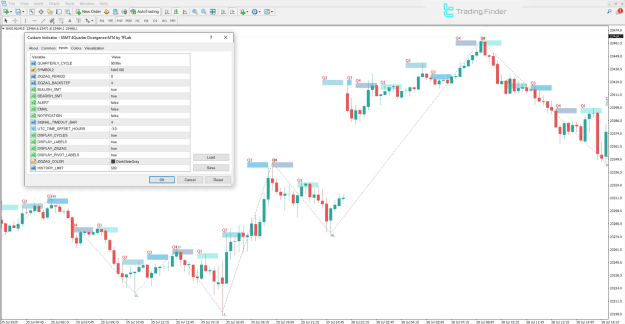
SSMT 4 Quarter Divergence Settings Overview
The SSMT Indicator offers a comprehensive and adjustable settings panel, allowing traders to fine-tune analytical parameters for improved precision and control:
- QUARTERLY CYCLE: Defines the selected quarterly time division
- SYMBOL2: Specifies the secondary correlated asset
- ZIGZAG PERIOD: Adjusts the sensitivity of the zigzag algorithm
- ZIGZAG BACKSTEP: Determines the number of retracement candles for pivot confirmation
- BULLISH SMT / BEARISH SMT: Activates divergence signal modes
- ALERT / EMAIL / NOTIFICATION: Configures alert delivery and notification preferences
- SIGNAL TIMEOUT BAR: Sets signal duration in candle count
- UTC TIME OFFSET HOURS: Aligns alerts with local time settings
- DISPLAY CYCLES / LABELS / ZIGZAG: Enables or disables chart visualization elements
- DISPLAY PIVOT LABELS: Shows pivot-related markers
- ZIGZAG COLOR: Customizes the color of zigzag lines
- HISTORY LIMIT: Limits the number of candles used for historical analysis
These customizable features enhance visual clarity, signal responsiveness, and overall analytical efficiency within the SSMT divergence framework.
Related Trading Tools You May Like
- Crypto Fear & Greed Index Tool – Market Sentiment Analysis
- Currency Converter – Convert 24 Fiat Currencies Instantly
- TradingFinder Fibonacci Calculator Tool 2025
- TradingFinder Margin Calculator Tool 2025 – Leverage up to 1:1000
Conclusion
In the SSMT 4 Quarter Divergence Indicator, a quarter represents the segmentation of a chosen timeframe (daily, weekly, etc.) into four equal market phases for more accurate price behavior analysis.
By aligning these divisions with divergence between correlated assets, traders can effectively identify institutional phase shifts and smart money movements with remarkable accuracy.
Since quarterly transitions frequently coincide with smart money entries or exits, the SSMT 4 Quarter Divergence Indicator provides traders with a strategic advantage in recognizing trend reversals and continuations with minimal risk exposure.