The indicator displays these crucial areas on the chart as both major and minor levels, which consistently function as important support and resistance zones, providing clear visual cues for potential market reactions.
https://cdn.tradingfinder.com/file/4...4-by-tflab.zip
https://www.cryptocraft.com/thread/1...tatrader-5-mt5
https://www.forexfactory.com/thread/...-in-metatrader
Prop Firm DrawDown Protector : Prop Firm Capital Protection Expert MT4 | Forex Money Management: Forex Trade Management Expert MT4 |ICT Concepts Indicator MT4 | Smart Money Concepts Expert MT4| Smart Money Trap Scanner | Get a free Expert Advisor license via Telegram and WhatsApp
Sweet Spots Indicator at a Glance
This tool falls into several key analytical categories, making it versatile for various trading styles and instruments.
Indicator Categories
- Support & Resistance MT4 Indicators
- Trading Assist MT4 Indicators
- Levels MT4 Indicators
- Breakout MT4 Indicators
- Reversal MT4 Indicators
Platform and Trading Applicability
- Platforms: This indicator is designed for the MetaTrader 4 platform.
- Trading Skills: It is suitable for traders at an elementary skill level due to its clear visual output.
- Timeframe: It is a multi-timeframe indicator, providing valuable levels across any chart interval.
- Trading Style: The Sweet Spots indicator is applicable for various styles, including Day Trading, Scalping, and Swing Trading.
- Trading Instruments: It is effective across major financial markets, including Forex, the Cryptocurrency market, and the Stock Market.
Trading with the Sweet Spots Indicator
The levels generated by this indicator serve as key psychological barriers that frequently act as price reaction points. Traders can identify potential entry points for buy or sell positions when the price approaches these levels, often confirming the signal with additional price action strategies.
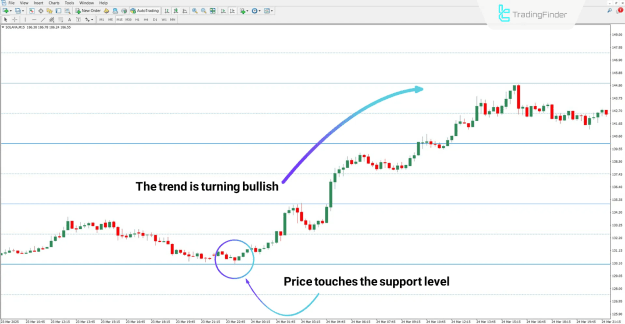
Bullish Trend Conditions
In a bullish context, the indicator's levels can identify robust support zones. For instance, on a 15-minute chart of Solana (SOL), the price may touch a marked level and initiate a consistent upward movement.
As illustrated in this scenario, the blue line acts as a dynamic support level, presenting a suitable entry opportunity for traders looking to go long. The key is to observe the price reaction at the level for confirmation.
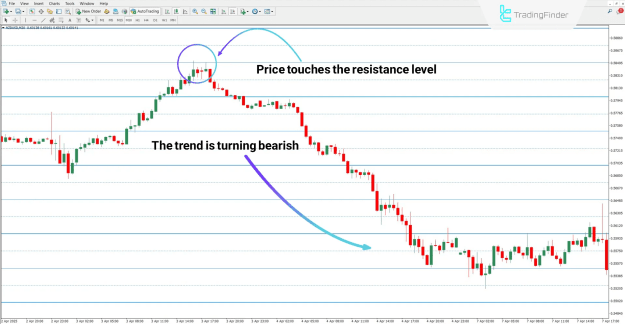
Bearish Trend Conditions
Conversely, in a bearish or ranging market, these levels can act as strong resistance. Based on a 30-minute chart of the NZD/USD pair, a blue line can function as a resistance level, with the price beginning to decline after making contact.
In such a chart, the formation of a pin bar reversal pattern followed by a strong bearish candlestick could serve as a definitive warning and a confirmation signal for potential sell trade setups. The resistance level provides the context for the reversal.
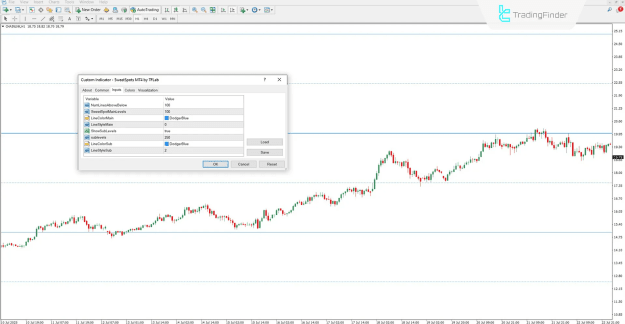
Sweet Spots Indicator Settings
The functionality and appearance of the Sweet Spots indicator can be customized through its settings panel to suit individual trading preferences. The primary configuration options include:
- NumLinesAboveBelow: This parameter controls the number of psychological lines plotted both above and below the current market price.
- SweetSpotMainLevels: This defines the price distance, or pip interval, between the major psychological price levels.
- LineColorMain: Allows the user to set the display color for the main level lines.
- LineStyleMain: Determines the visual style (e.g., solid, dashed) of the main level lines.
- ShowSubLevels: A toggle to enable or disable the visibility of the intermediate sub-levels on the chart.
- Sublevels: This setting defines the price distance between the sub-levels, which are typically less significant than the main levels.
- LineColorSub: Sets the display color for the sub-level lines.
- LineStyleSub: Determines the visual style of the sub-level lines.
Conclusion
The Sweet Spots indicator is a widely utilized tool in technical analysis that automates the process of identifying and marking key psychological price levels on a chart. These levels represent critical support and resistance zones where the price has a high probability of reacting. By providing a clear visual framework, the indicator assists traders in making more informed decisions regarding entry, exit, and market structure analysis across various timeframes and instruments.