This ICT MT4 indicator analyzes the convergence and divergence of candle closings across two or three correlated trading symbols to determine signs of market strength or weakness in the current trend. Visual signals are provided directly on the chart through colored arrows. A live data table is also incorporated to display the real-time status of divergence or convergence between the selected assets.
https://cdn.tradingfinder.com/file/4...-mt4-tflab.zip
https://www.cryptocraft.com/thread/1...nced-precision
https://www.forexfactory.com/thread/...-in-metatrader
Prop Firm DrawDown Protector : Prop Firm Capital Protection Expert MT4 | Forex Money Management: Forex Trade Management Expert MT4 |ICT Concepts Indicator MT4 | Smart Money Concepts Expert MT4| Smart Money Trap Scanner | Get a free Expert Advisor license via Telegram and WhatsApp
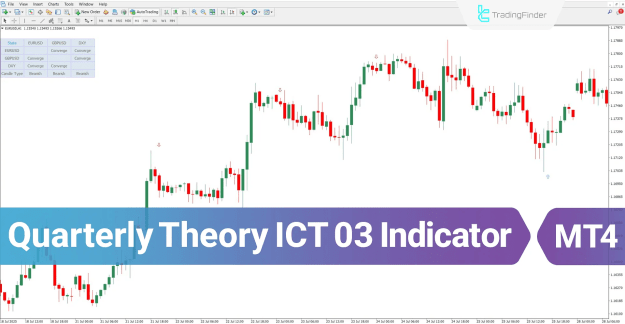
Specifications of the Quarterly Theory ICT 03 Indicator
This section outlines the functional categories and requirements of the Quarterly Theory ICT 03 Precision Swing Points indicator:
- Indicator Categories:
- ICT MT4 Indicators
- Pivot Points & Fractals MT4 Indicators
- Signal & Forecast MT4 Indicators
- Platforms:
- MetaTrader 4 Indicators
- Trading Skills:
- Advanced
- Indicator Types:
- Reversal MT4 Indicators
- Timeframe:
- Multi-Timeframe MT4 Indicators
- Trading Style:
- Day Trading MT4 Indicators
- Scalper MT4 Indicators
- Swing Trading MT4 Indicators
- Trading Instruments:
- Forex MT4 Indicators
- Stock Market MT4 Indicators
- Cryptocurrency MT4 Indicators
Quarterly Theory ICT 03 Indicator at a Glance: Precision Swing Point Logic
The Precision Swing Points pattern is constructed from three consecutive candles, with the middle candle holding the key significance for signal generation.
The indicator's logic for generating buy and sell signals based on divergence is as follows:
- Positive Divergence (Buy Signal): A positive divergence is registered—prompting a buy signal—if the middle candle is bearish on the base symbol and bullish on the correlated symbol.
- Negative Divergence (Sell Signal): A negative divergence is identified—resulting in a sell signal—if the middle candle is bullish on the base symbol and bearish on the correlated symbol.
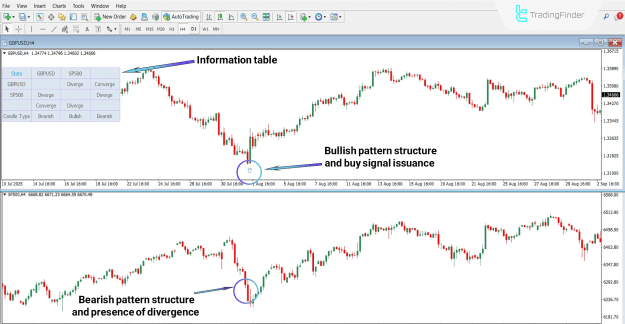
Buy Signal Implementation
Consider an example where GBP/USD is set as the base symbol and SP500 as the correlated symbol. If the upper chart (base currency) exhibits a bullish pattern while the lower chart (correlated symbol) simultaneously shows a bearish pattern, the Quarterly Theory ICT 03 Indicator will generate a buy signal on the GBP/USD chart, detecting the divergence between symbols.
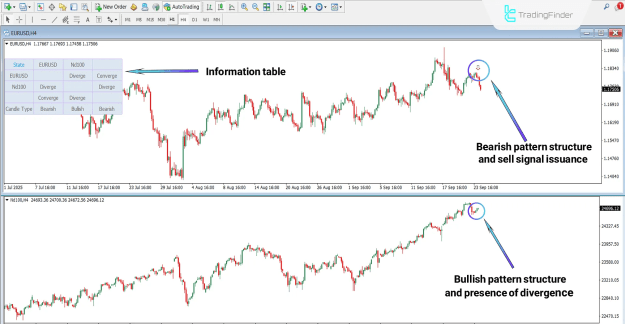
Sell Signal Implementation
As an illustration for a sell signal, let EUR/USD be the base symbol and Nd100 be the correlated symbol. If the analysis shows a precise bearish pivot pattern on the upper chart (EUR/USD) and a corresponding bullish pattern appears on the lower chart (correlated symbol), the indicator detects this divergence and issues a sell signal. This confirms a Bearish Precision Swing Point.
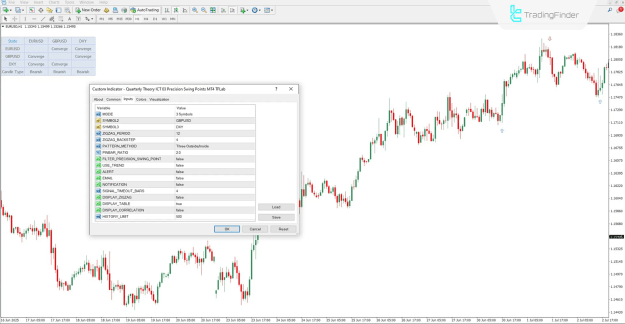
Quarterly Theory ICT 03 Precision Swing Points Indicator Settings
The indicator provides a comprehensive settings panel, offering extensive customization for the trading analysis and alert functions:
- Comparison Mode:
- MODE: Selects the asset comparison mode (two or three symbols).
- SYMBOL2 / SYMBOL3: Options to select the second and third correlated symbols.
- Pattern and Filter Controls:
- ZIGZAG_PERIOD / ZIGZAG_BACKSTEP: Parameters for the ZigZag line calculation, defining the calculation period and minimum number of candles between swing points.
- PATTERN_METHOD: Determines the structure of the candlestick pattern.
- PINBAR_RATIO: The threshold ratio used for validating a pin bar.
- FILTER_PRECISION_SWING_POINT: Enables a filter to display only the most precise patterns.
- USE_TREND: Applies a filter to display signals exclusively in the direction of the market trend.
- Alerts and Notifications:
- ALERT: Enable chart alerts.
- EMAIL: Option to send trading signals via email.
- NOTIFICATION: Enable push notifications for signals.
- SIGNAL_TIMEOUT_BARS: Specifies the duration (in bars) for the signal to remain visible on the chart.
- Display Options:
- DISPLAY_ZIGZAG: Toggles the visibility of the ZigZag structure.
- DISPLAY_TABLE: Shows or hides the table that displays divergence and candle status.
- DISPLAY_CORRELATION: Toggles the display of correlation information in the table.
- HISTORY_LIMIT: Sets the number of past candles to be loaded and analyzed.
Conclusion
The Quarterly Theory ICT 03 Indicator is a sophisticated professional trading tool designed to pinpoint precise market turning points. Its primary function is based on identifying divergences across two or three correlated assets. By utilizing the three-candle Precision Swing Points structure, this MT4 indicator is engineered to generate definitive bullish or bearish signals on the fourth candle, immediately following the close of the third. A crucial feature is the inclusion of a real-time table on the chart, which presents vital data like divergence status and candlestick types.