- Trend Identification: Using a moving average, the screener filters out minor market fluctuations to clearly identify the dominant trend as either bullish or bearish. This helps traders determine the market's primary direction.
- Volatility and Support/Resistance: By employing ATR, the tool measures actual market volatility and plots dynamic bands around the price. These bands serve as dynamic support and resistance levels, providing crucial zones for price reaction and potential breakouts.
This combination creates a powerful, multi-layered instrument for trend analysis, risk management, and pinpointing important price zones. The screener also features a dashboard that allows for the simultaneous analysis of up to 10 symbols across multiple timeframes.
You can access the Indicator from this link:
https://tradingfinder.com/products/i...nals-screener/
Prop Firm DrawDown Protector : Prop Firm Capital Protection Expert MT5 |Forex Money Management: Forex Trade Management Expert MT5 | ICT Concepts Indicator MT5 |Smart Money Concepts Expert MT5 | Smart Money Trap Scanner | Get a free Expert Advisor license via Telegram and WhatsApp
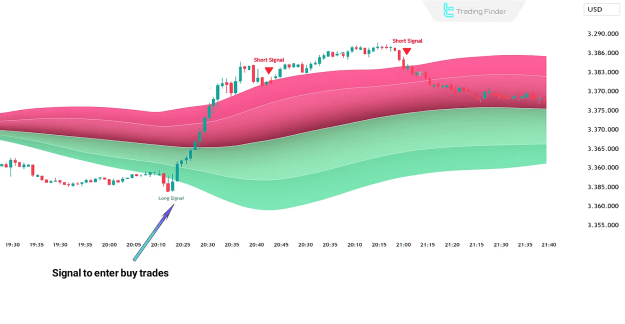
How the Screener Performs in an Uptrend
In a bullish market, the screener identifies the trend when the price is consistently trading above the moving average midline. This indicates a strong upward momentum.
- A buy signal is generated when the price breaks and closes above the upper ATR band.
- The lower ATR band functions as a dynamic support level. A price touch to this band is often considered a renewed opportunity to enter long trades.
- Sustained price action above the midline signifies a strengthening of the existing uptrend.
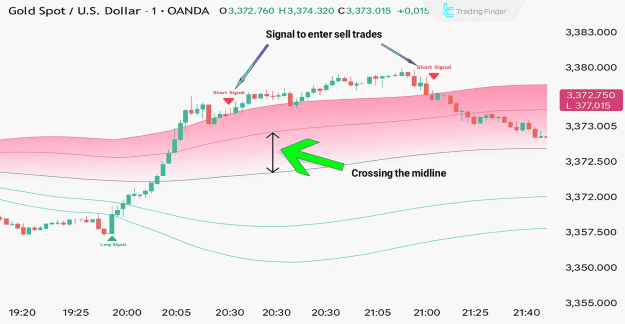
How the Screener Performs in a Downtrend
In a bearish market, the screener signals a prevailing downtrend when the price moves and consolidates below the moving average midline. This setup suggests increasing selling pressure.
- A sell signal is issued when the price breaks below the lower ATR band.
- The upper ATR band serves as a dynamic resistance level. A touch of the price to this level can present a suitable opportunity for entering short trades.
- A rebound back above the lower ATR band after a breakout can indicate the potential start of a new bearish wave.
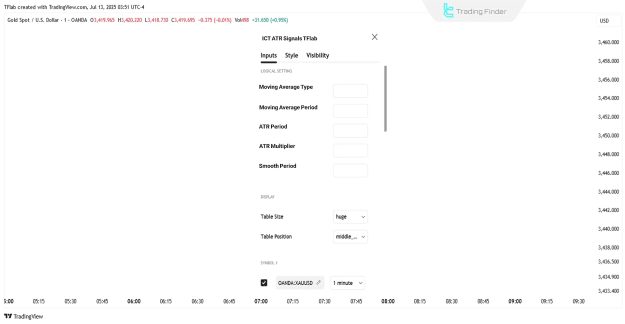
Key Settings and Features
The ICT ATR Signals Screener offers extensive customization options to suit a trader's specific strategy. The settings are categorized for ease of use.
- Logical Settings:
- Moving Average: Users can adjust the type and period of the moving average.
- ATR: The period and multiplier for the ATR calculation are configurable.
- Smoothing Period & Signal Gap: These settings allow for fine-tuning signal sensitivity.
- Display Settings:
- Dashboard: The screener's dashboard can be toggled on or off the chart.
- Symbols & Mode: Users can select the number of symbols (up to 10) to monitor and choose the table's display mode, size, and position.
- Alert Settings:
- Alerts: The screener provides customizable alerts for buy and sell signals.
- Frequency: The frequency of alert messages can be set to avoid redundancy.
- Time Zone: Alert times can be displayed based on the user's local time zone.
- Symbol Settings:
- The tool provides the ability to simultaneously analyze up to 10 different trading instruments, including Forex, cryptocurrencies, stocks, commodities, and indices.
Conclusion
In summary, the ICT ATR Signals Screener is a comprehensive and intelligent tool that goes beyond simple trend analysis. By integrating a moving average for directional filtering and ATR for volatility measurement and support/resistance identification, it provides a holistic view of the market. Its dashboard functionality makes it a powerful instrument for traders who need to monitor multiple assets simultaneously and execute trades based on validated buy and sell signals.