You can access the Indicator from this link:
https://tradingfinder.com/products/i...-pivot-points/
You can access the Indicator on the TradingView website:
https://www.tradingview.com/script/Q...rt-Resistance/
Prop Firm DrawDown Protector : Prop Firm Capital Protection Expert MT5 |Forex Money Management: Forex Trade Management Expert MT5 | ICT Concepts Indicator MT5 |Smart Money Concepts Expert MT5 | Smart Money Trap Scanner | Get a free Expert Advisor license via Telegram and WhatsApp
Key Indicator Specifications
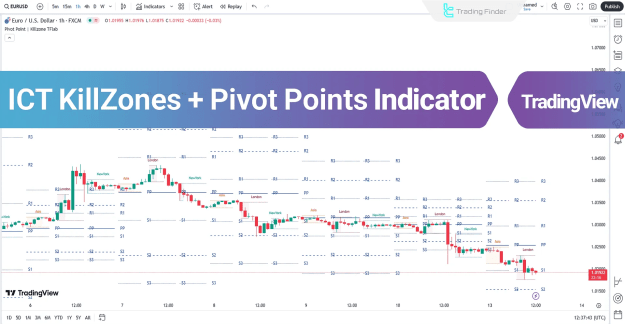
The ICT KillZones + Pivot Points indicator is categorized as an essential tool for intermediate-level traders. It is a reversal indicator that helps pinpoint potential shifts in market direction.
- Indicator Categories: It falls under Pivot Points & Fractals, Liquidity, and Session & KillZone indicators.
- Platforms: Optimized for TradingView.
- Timeframes: It is a multi-timeframe indicator, adaptable to various chart periods.
- Trading Style: Specifically suited for intraday trading.
- Trading Instruments: Applicable across numerous markets, including Forex, Cryptocurrency, Stocks, Commodities, Indices, and Futures.
Analyzing Market Trends with the ICT KillZones + Pivot Points Indicator
The indicator provides a clear framework for identifying and analyzing both bullish and bearish market conditions.
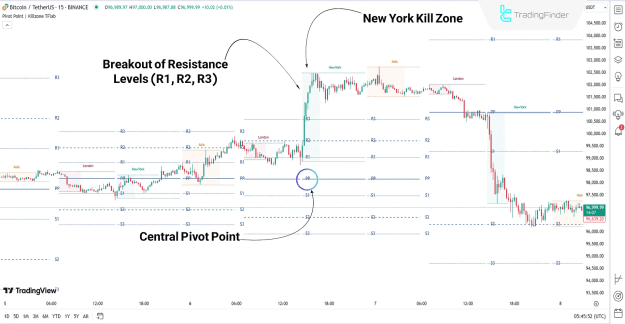
Bullish Trend Analysis
On a 15-minute Bitcoin (BTC) chart, a bullish trend is indicated when the price remains above the central pivot point (PP). As the price entered the New York Kill Zone, a significant surge of buy orders was observed. This led the price to break through key resistance pivot levels (R1, R2, R3), confirming the upward momentum.
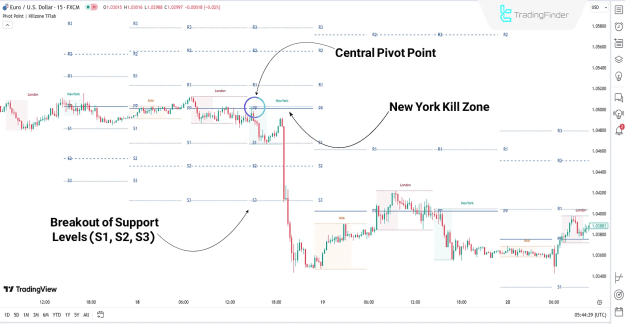
Bearish Trend Analysis
Conversely, an analysis of the EUR/USD chart demonstrates a bearish trend when the price crosses below the central pivot point (PP). During a subsequent return to significant price levels within the New York Kill Zone, the price then moved strongly toward lower targets. This bearish movement was confirmed as the price broke through key support pivot levels (S1, S2, S3). Note that in both the bullish and bearish examples, Floor Pivot Points were used for the analysis.
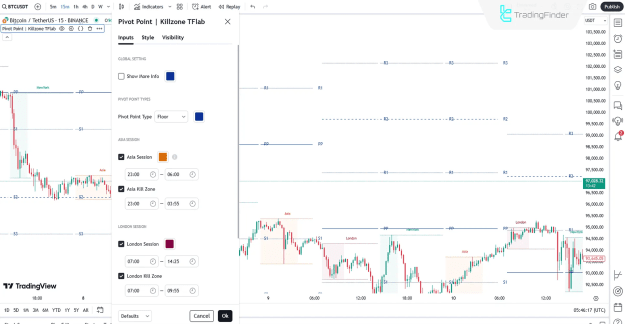
Indicator Settings
The ICT KillZones + Pivot Points indicator offers a range of customizable settings on the TradingView platform to suit a trader's specific strategy.
- Global Settings: The "Show More Info" option provides additional details about the Pivot Points.
- Pivot Point Type: This setting allows users to select the desired type of pivot points, which includes Floor, Camarilla, Woodie, and Fibonacci.
- Session Settings: Traders can enable or disable specific trading sessions and their corresponding Kill Zones, including the Asia Session, London Session, and New York Session.
Conclusion
The ICT KillZones + Pivot Points indicator is an effective and comprehensive tool that merges Pivot Points and volatile time zones (Kill Zones) for precise market analysis. This Pivot Point Fractal Indicator is equipped with four distinct pivot types—Floor, Camarilla, Woodie, and Fibonacci—each designed to highlight key support and resistance zones and provide insight into prevailing market trends.