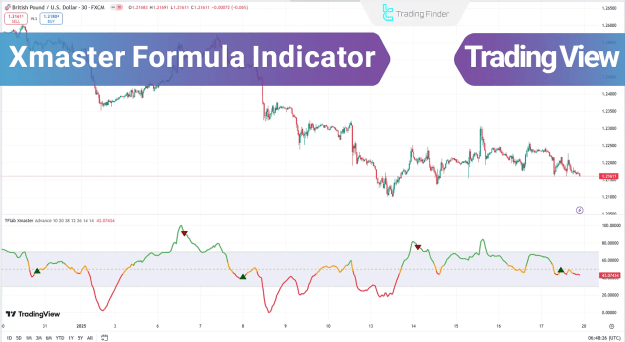
The Xmaster (XHMaster) Formula Indicator is a powerful TradingView tool designed for Forex trading, offering precise Buy and Sell signals. Combining Exponential Moving Averages (EMA) and Moving Average Convergence Divergence (MACD), this indicator helps traders identify trends, price movements, and market strength.
Additionally, the Stochastic Oscillator, Relative Strength Index (RSI), and Parabolic SAR enhance its accuracy by detecting potential reversals and trend changes.
You can access the Indicator from this link:
https://tradingfinder.com/products/i...aster-formula/
You can access the Indicator on the TradingView website:
https://www.tradingview.com/script/g...nt-Strategies/
Prop Firm DrawDown Protector : Prop Firm Capital Protection Expert MT5 |Forex Money Management: Forex Trade Management Expert MT5 | ICT Concepts Indicator MT5 |Smart Money Concepts Expert MT5 | Smart Money Trap Scanner | Get a free Expert Advisor license via Telegram and WhatsApp
Key Features of the XHMaster Formula Indicator
1. Multi-Indicator Analysis
The Xmaster Formula integrates:
Additionally, the Stochastic Oscillator, Relative Strength Index (RSI), and Parabolic SAR enhance its accuracy by detecting potential reversals and trend changes.
You can access the Indicator from this link:
https://tradingfinder.com/products/i...aster-formula/
You can access the Indicator on the TradingView website:
https://www.tradingview.com/script/g...nt-Strategies/
Inserted Video
Prop Firm DrawDown Protector : Prop Firm Capital Protection Expert MT5 |Forex Money Management: Forex Trade Management Expert MT5 | ICT Concepts Indicator MT5 |Smart Money Concepts Expert MT5 | Smart Money Trap Scanner | Get a free Expert Advisor license via Telegram and WhatsApp
Key Features of the XHMaster Formula Indicator
1. Multi-Indicator Analysis
The Xmaster Formula integrates:
- EMA – Identifies trend direction.
- MACD – Measures trend strength and momentum.
- RSI & Stochastic Oscillator – Detects overbought/oversold conditions.
- Parabolic SAR – Confirms trend reversals.
2. Two Signal Modes: Standard & Advanced
Standard Mode
- Uses normalized moving averages for quick signals.
- Buy Signal: Triggered when the value exceeds 55 (green trendline).
- Sell Signal: Activated when the value drops below 45 (red trendline).
- Ideal for fast trades and scalping.
Advanced Mode
Combines multiple indicators for higher accuracy:
- MACD: Buy when histogram is positive; Sell when negative.
- RSI: Buy below 30 (oversold); Sell above 70 (overbought).
- Stochastic: Buy below 20; Sell above 80.
- Parabolic SAR: Buy when dots are below price; Sell when above.
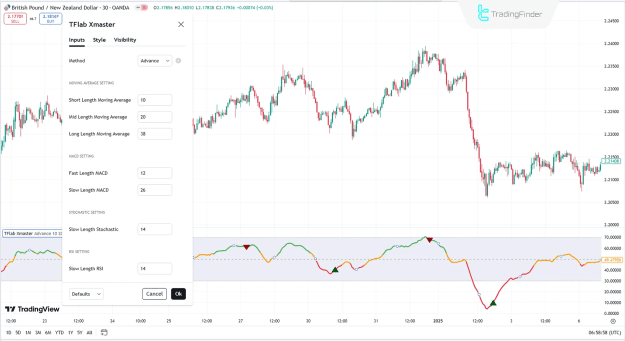
Indicator Settings & Customization
Moving Average Configuration
- Short-Term Length: Adjusts the fast EMA period.
- Mid-Term Length: Fine-tunes intermediate trend analysis.
- Long-Term Length: Sets the slow EMA for broader trends.
MACD Settings
- Fast & Slow Length: Optimizes sensitivity for trend detection.
RSI & Stochastic Settings
- Slow Length: Controls smoothing for reversal signals.
Practical Application in Trading
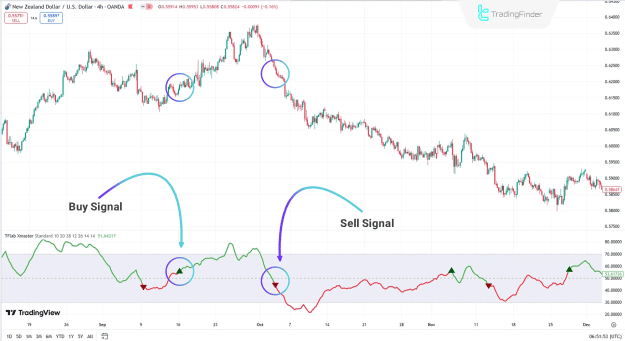
Example 1: Uptrend Analysis (4H NZD/USD Chart)
- In Standard Mode, the Xmaster (XHMaster) Formula shows clear Buy/Sell signals based on EMA crossovers.
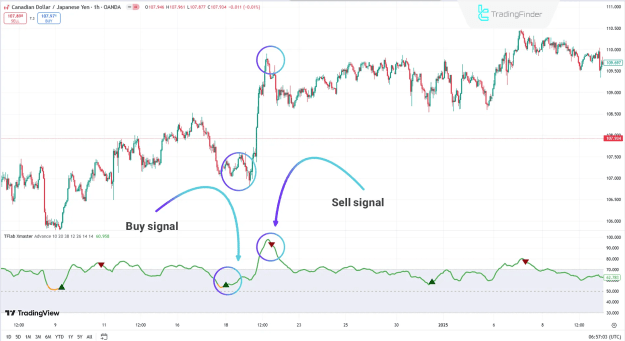
Example 2: Downtrend Detection (1H CAD/JPY Chart)
- Advanced Mode combines MACD, RSI, and Parabolic SAR for high-confidence trades.
Conclusion
The Xmaster Formula Indicator is a versatile TradingView tool suitable for:
- Scalpers & Intraday Traders (Standard Mode).
- Swing Traders & Risk Managers (Advanced Mode).
With EMA, MACD, RSI, Stochastic, and Parabolic SAR, it provides high-precision signals for Forex, Stocks, and Indices.
For MetaTrader users, the Formula X Master MT5 Indicator offers similar functionality with customizable settings.
Attached Image(s) (click to enlarge)