You can access the Indicator from this link:
https://tradingfinder.com/products/i...ssion-channel/
You can access the Indicator on the TradingView website:
https://www.tradingview.com/script/D...ng-Trend-Line/
Prop Firm DrawDown Protector : Prop Firm Capital Protection Expert MT4 | Forex Money Management: Forex Trade Management Expert MT4 |ICT Concepts Indicator MT4 | Smart Money Concepts Expert MT4| Smart Money Trap Scanner | Get a free Expert Advisor license via Telegram and WhatsApp
Key Components of the Indicator
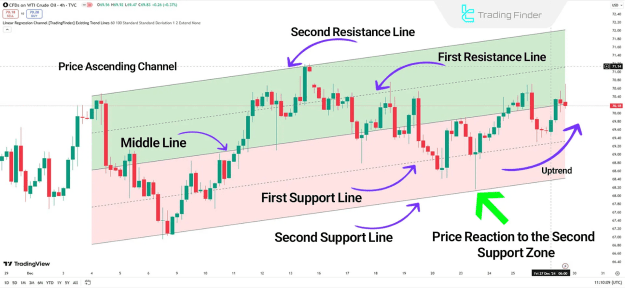
The Linear Regression Channel consists of five primary elements:
- Middle Line: The linear regression line representing the overall market trend.
- First Support Line: Located below the middle line, serving as the initial support level.
- Second Support Line: Positioned beneath the first, indicating stronger support.
- First Resistance Line: The first resistance level above the middle line.
- Second Resistance Line: A higher resistance line representing a stronger barrier in the market.
Indicator Specifications
- Categories: Support & Resistance, Trading Assist, Levels
- Platforms: TradingView
- Skill Level: Elementary
- Indicator Type: Reversal
- Timeframe: Multi-Timeframe
- Trading Style: Day Trading
- Markets: Forex, Stocks, Cryptocurrencies, Forward Trading
Overview of the Linear Regression Channel
The LRC is primarily used to:
- Identify entry and exit zones
- Analyze breakouts
- Assess price reversion to the mean
In this setup, the lower channel line acts as support, while the upper line acts as resistance. Breakouts above or below these lines indicate the strength of buyers or sellers. The Middle Line, functioning similarly to a moving average, often triggers price reactions.
Using the Indicator in Uptrends
On a 4-hour price chart (e.g., oil index), the Middle Line slopes upward. Prices oscillate between the middle and resistance lines. Traders typically enter buy trades after price breaks the middle line and approaches the second support line.
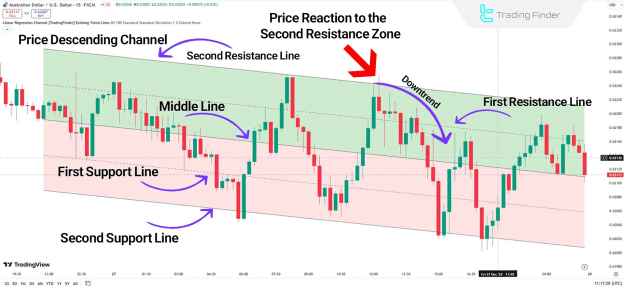
Using the Indicator in Downtrends
For descending channels (e.g., AUD/USD pair), the Middle Line slopes downward, and prices move between resistance and support lines. The second resistance line may act as a reversal zone. Traders can enter sell trades after confirming reversal signals, such as Doji candles.
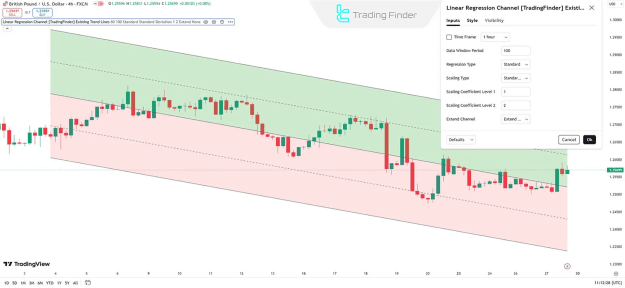
Indicator Settings
- Time Frame: Set the desired timeframe
- Data Window Period: Number of recent candles used for calculation
- Regression Type: Select the regression analysis method
- Scaling Type: Choose the scaling method
- Scaling Coefficient Level 1 & 2: Adjust scaling levels
- Extend Channel: Extend the channel to forecast future price movement
Conclusion
The Linear Regression Channel Indicator is an effective tool for predicting price behavior and analyzing trends in financial markets. Widely used in Forex, Stocks, and Cryptocurrencies, this indicator helps traders with risk management, trend analysis, and identifying key price levels for informed decision-making.