This pattern is often observed during the first and second waves of the Elliott Wave Theory. In this context, the initial XA wave corresponds to Wave 1, while the subsequent ABCD correction represents Wave 2. The core of the Gartley pattern is its alignment with specific Fibonacci retracement and extension levels.
You can access the Indicator from this link:
https://tradingfinder.com/products/i...monic-pattern/
You can access the Indicator on the TradingView website:
https://www.tradingview.com/script/K...hart-patterns/
Prop Firm DrawDown Protector : Prop Firm Capital Protection Expert MT5 |Forex Money Management: Forex Trade Management Expert MT5 | ICT Concepts Indicator MT5 |Smart Money Concepts Expert MT5 | Smart Money Trap Scanner |Get a free Expert Advisor license via Telegram and WhatsApp
Understanding the Gartley Pattern's Key Components
The Gartley pattern is characterized by four distinct points, each crucial for identifying the pattern and predicting market movements.
- Point X: This marks the starting point of the initial price swing and serves as the baseline for the entire pattern analysis.
- Point A: This signifies the end of the initial price movement, establishing the first leg of the pattern.
- Point B: This point represents a correction of the XA wave. It typically retraces to the 61.8% Fibonacci level of the XA leg.
- Point C: This point is a correction of the AB wave, and its retracement usually falls within the 38% to 79% Fibonacci range of the AB leg.
- Point D: This is the final point of the pattern and the end of the correction. The Potential Reversal Zone (PRZ) is typically found near the 113% to 162% Fibonacci extension of the BC wave.
Recognizing the Gartley Pattern in Different Market Trends
The appearance of the Gartley pattern varies depending on the market trend it forms in.
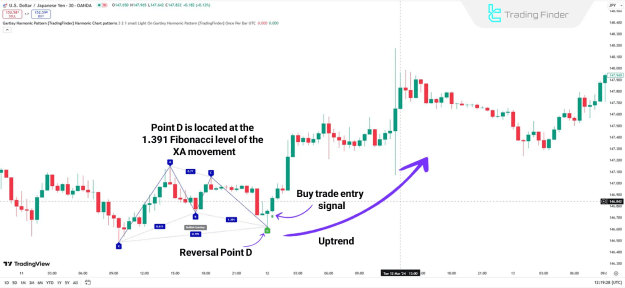
- Bullish Gartley Pattern (Uptrend):
- The initial XA movement is upward.
- The AB movement corrects downward.
- The BC movement moves upward.
- The final CD movement corrects downward.
- Visually, this pattern resembles an "M" shape.
- The indicator signals a potential bullish reversal at Point D, often displaying a green arrow to indicate a high-potential entry point for a long trade.
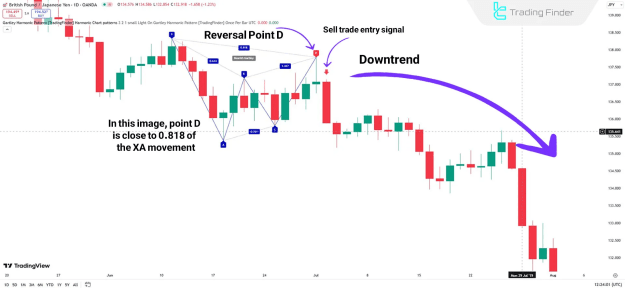
- Bearish Gartley Pattern (Downtrend):
- The initial XA movement is downward.
- The AB movement corrects upward.
- The BC movement moves downward.
- The final CD movement corrects upward.
- Visually, this pattern resembles a "W" shape.
- The indicator signals a potential bearish reversal from Point D, indicating a potential drop in price.
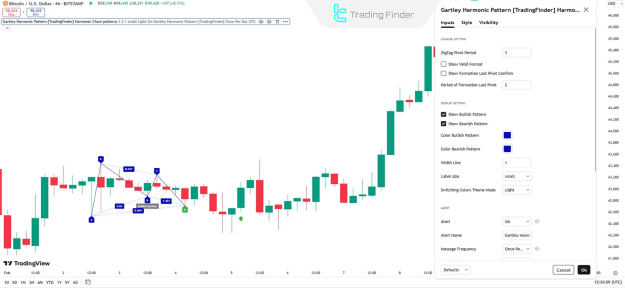
Customizing the Gartley Harmonic Pattern Indicator Settings
The indicator on TradingView comes with a range of customizable settings that allow traders to fine-tune its performance and appearance.
Logical Settings
- ZigZag Pivot Period: Determines the sensitivity of the pattern detection (default is 3).
- Show Valid Format: Displays only patterns that meet the specific Gartley ratio requirements.
- Show Formation Last Pivot Confirm: Confirms the final pivot point before displaying the pattern.
Display Settings
- Period of Formation Pivot: Controls the time frame for the last pivot's formation (default is 2).
- Show Bullish/Bearish Pattern: Toggles the display of bullish and bearish patterns.
- Color Bullish/Bearish Pattern: Allows for custom color coding of the patterns (default is blue for bullish and red for bearish).
- Width Line: Adjusts the thickness of the pattern lines.
- Label Size: Changes the size of the text labels on the chart.
- Switching Colors Theme Mode: Adapts the indicator's colors to match the chart's background theme.
Alert Settings
- Alert: Enables real-time notifications for new pattern formations.
- Alert Name: Allows users to set a custom name for the alert.
- Message Frequency: Customizes the content and frequency of alert messages.
- Show Alert Time By Time Zone: Displays alert times based on the user's selected time zone.
Conclusion
The Gartley Harmonic Pattern Indicator is a valuable tool for traders who want to analyze price structures and Fibonacci ratios to identify high-potential market reversal zones. By combining this indicator with a solid understanding of technical analysis, a robust risk management strategy, and hands-on trading experience, traders can significantly improve their ability to spot profitable trading opportunities across various financial markets.