You can access the Indicator from this link:
https://tradingfinder.com/products/i...monic-pattern/
You can access the Indicator on the TradingView website:
https://www.tradingview.com/script/Q...hart-patterns/
Prop Firm DrawDown Protector : Prop Firm Capital Protection Expert MT5 |Forex Money Management: Forex Trade Management Expert MT5 | ICT Concepts Indicator MT5 |Smart Money Concepts Expert MT5 | Smart Money Trap Scanner |Get a free Expert Advisor license via Telegram and WhatsApp
Key Features and Functionality
The Crab Harmonic Pattern is characterized by its distinct shape—an "M" for a bullish pattern and a "W" for a bearish one. The indicator uses a series of precise Fibonacci retracement and extension levels to define this pattern.
- Pattern Structure:
- Point B: A retracement of the XA leg, falling between 38.2% and 61.8%.
- Point C: A retracement of the AB leg, ranging from 38.2% to 88.6%.
- Point D (Potential Reversal Zone or PRZ): This is the critical point for traders. It is an extension of the XA leg, typically at 161.8% or higher, and marks the zone where a price reversal is most likely to occur.
- Trading Signals:
- A bullish Crab Pattern ends at point D, which serves as a Buy Zone, and is visually represented by a green arrow on the chart.
- A bearish Crab Pattern also ends at point D, which acts as a Sell Zone, and is indicated by a red arrow.
How the Indicator Works in Different Market Conditions
This indicator is versatile and can be applied across various financial instruments and timeframes, making it suitable for different trading styles, including intraday trading.
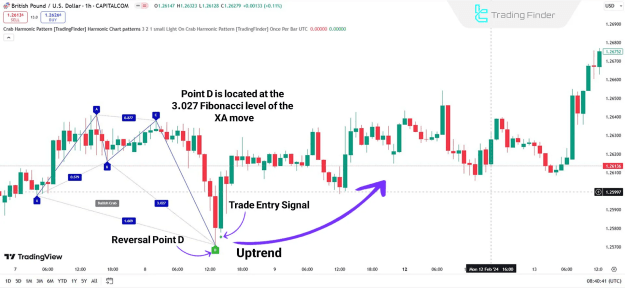
- In an Uptrend (Bullish Pattern):
- A bullish pattern begins with an initial upward price movement, followed by a retracement.
- The indicator identifies the pattern’s completion and displays a green arrow, signaling a potential upward trend continuation or reversal.
- Example: This can be seen on a currency pair like GBP/USD, where the indicator identifies the "M" shape before a potential buying opportunity.
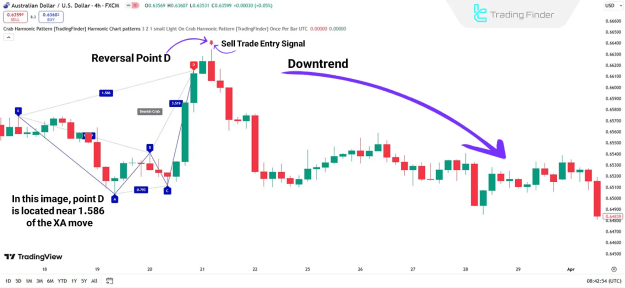
- In a Downtrend (Bearish Pattern):
- A bearish pattern typically starts with a corrective move in a downtrend, creating a "W" shape.
- Once the pattern is complete, the indicator generates a red arrow at the peak, indicating a potential downward reversal and a selling opportunity.
- Example: This pattern can be observed on a chart like AUD/USD.
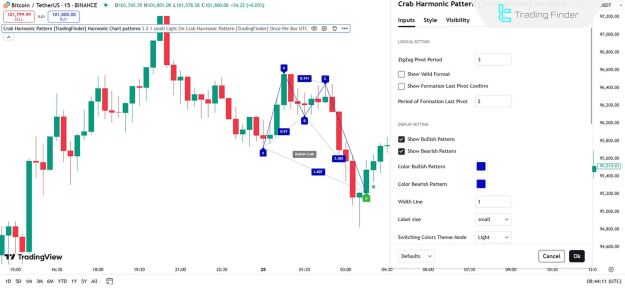
Indicator Settings and Customization
The Crab Harmonic Pattern Indicator offers extensive customization to align with a trader's specific strategy and chart preferences.
- Logical Settings: These allow you to fine-tune the pattern detection, including the ZigZag Pivot Period for calculating pivots and options to show only valid patterns and confirmation of the last pivot.
- Display Settings: You can customize how patterns are visualized on the chart. This includes enabling or disabling bullish or bearish patterns, changing their colors, adjusting line thickness, and modifying the text label size.
- Alerts: The indicator supports alerts to notify traders when a new pattern is detected, with customizable alert names and message frequency. This is particularly useful for traders who cannot constantly monitor charts.
Conclusion
In conclusion, the Crab Harmonic Pattern Indicator is a powerful tool for intermediate traders on the TradingView platform. By automatically identifying key harmonic pattern points and Potential Reversal Zones, it simplifies the process of finding trade entry and exit signals in various markets, including Forex, cryptocurrencies, and stocks.