You can access the Indicator from this link:
https://tradingfinder.com/products/i...ower-of-three/
You can access the Indicator on the TradingView website:
https://www.tradingview.com/script/5...Accumulations/
Prop Firm DrawDown Protector : Prop Firm Capital Protection Expert MT5 |Forex Money Management: Forex Trade Management Expert MT5 | ICT Concepts Indicator MT5 |Smart Money Concepts Expert MT5 | Smart Money Trap Scanner |Get a free Expert Advisor license via Telegram and WhatsApp
Key Features of the ICT Power Of 3 Indicator
- Indicator Category: This indicator falls under ICT Tradingview Indicators, Smart Money Tradingview Indicators, and Liquidity Tradingview Indicators.
- Platforms: It is specifically built for use on the Trading View platform.
- Trading Skill Level: An advanced level of trading skill is required to effectively use this indicator.
- Indicator Type: It is classified as a Leading Tradingview Indicator, as it aims to predict future market movements.
- Timeframes: The indicator is suitable for various timeframes, including M1-M5, M15-M30, and H1-H4.
- Trading Style: It is useful for both Fast Scalping and Scalping trading styles.
- Trading Instruments: It can be applied to various markets, including Forex and Cryptocurrency trading instruments.
The Three Phases of Market Movement
The ICT Power Of 3 strategy divides the market into three distinct phases, each representing specific market movements driven by institutional traders:
- Accumulation (19:00 - 01:00): During this phase, market makers quietly accumulate their positions within a horizontal price range. This period is characterized by low volatility and subtle price movements, as institutions aim to gather orders without attracting attention from retail traders.
- Manipulation (01:00 - 07:00): This phase is designed to deceive retail traders. The market experiences false breakouts and liquidity traps, where institutional traders create misleading price movements to trigger stop-losses and lure retail traders into taking incorrect positions.
- Distribution (07:00 - 13:00): In this final phase, institutions begin to offload their accumulated positions. The market often transitions into a strong, fast-moving trend as liquidity gathered in the manipulation phase is used to initiate the primary market movement.
How the Indicator Works in an Uptrend and Downtrend
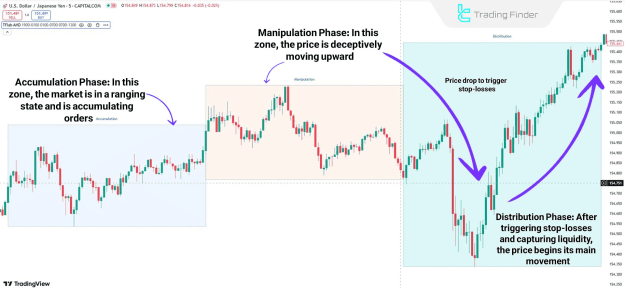
- Uptrend Example (USD/JPY, 5-minute timeframe):
- Accumulation: Price activates buy orders within a range, setting the foundation for the upcoming move.
- Manipulation: Price moves deceptively lower to mislead retail traders into short positions.
- Distribution: Market makers trigger stop-losses and collect liquidity before the price begins its main upward trend.
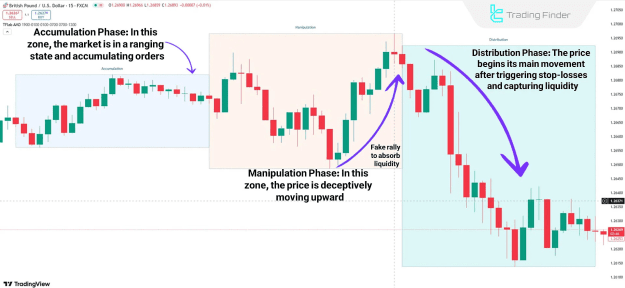
- Downtrend Example (GBP/USD, 1-hour timeframe):
- Accumulation: Price consolidates within a defined range, showing no clear trend.
- Manipulation: False breakouts and deceptive upward movements are created to entice retail traders into long positions.
- Distribution: After gathering liquidity and triggering stop-losses, the price abruptly reverses and initiates a strong downtrend.
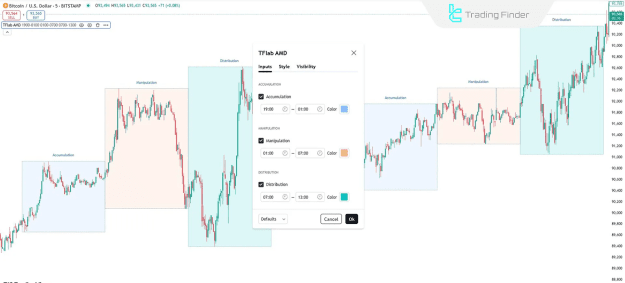
Indicator Settings and Zones
The ICT Power Of 3 Indicator visualizes these phases using distinct colored zones on the chart:
- Accumulation Phase (Blue Zone): Set from 19:00 to 01:00, this zone highlights the period of institutional accumulation.
- Manipulation Phase (Red Zone): Set from 01:00 to 07:00, this zone marks the period of false price movements and liquidity traps.
- Distribution Phase (Green Zone): Set from 07:00 to 13:00, this zone signifies the period where institutions offload positions, and the primary trend movement begins.
Conclusion
The ICT Power Of 3 Indicator is an invaluable tool for traders aiming to better understand market structure by analyzing the interplay between time and price dynamics. By visually identifying the Accumulation, Manipulation, and Distribution phases, it provides a clearer picture of how market makers operate, helping traders align their strategies with institutional movements rather than being caught by them.