This indicator is particularly useful for recognizing classic chart patterns such as:
- Head and Shoulders
- Triangles
- Elliott Waves
With its ability to simplify price action analysis, traders can make more informed decisions and refine their technical strategies.
You can access the Indicator from this link:
https://tradingfinder.com/products/i.../zigzag-multi/
You can access the Indicator on the TradingView website:
https://www.tradingview.com/script/t...es-Structures/
Prop Firm DrawDown Protector : Prop Firm Capital Protection Expert MT4 | Forex Money Management: Forex Trade Management Expert MT4 |ICT Concepts Indicator MT4 | Smart Money Concepts Expert MT4| Smart Money Trap Scanner | Get a free Expert Advisor license via Telegram and WhatsApp
Key Features of the Zigzag Multi Indicator
1. Pivot Points & Fractals
The indicator marks major and minor pivot points, allowing traders to distinguish between significant and minor market swings.
2. Elliott Wave Analysis
By identifying Higher Highs (HH), Higher Lows (HL), Lower Highs (LH), and Lower Lows (LL), the Zigzag Multi Indicator aids in Elliott Wave analysis, helping traders recognize wave structures and potential trend reversals.
3. Multi-Timeframe Compatibility
Suitable for various timeframes, this indicator adapts to different trading styles, including:
- Scalping
- Intraday Trading
- Swing Trading
4. Support & Resistance Levels
The indicator highlights critical support and resistance zones, enabling traders to spot key breakout or reversal areas.
How the Zigzag Multi Indicator Works
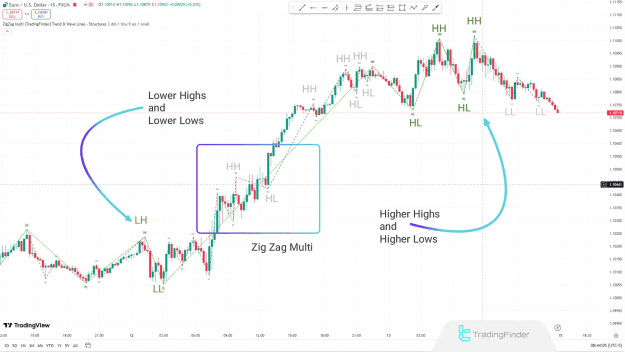
Uptrend Identification (EUR/USD Example)
In a 15-minute EUR/USD chart, the indicator plots Higher Highs (HH) and Higher Lows (HL), confirming an uptrend. By connecting these swing points, traders can visualize the trend’s direction and anticipate potential continuations or reversals.
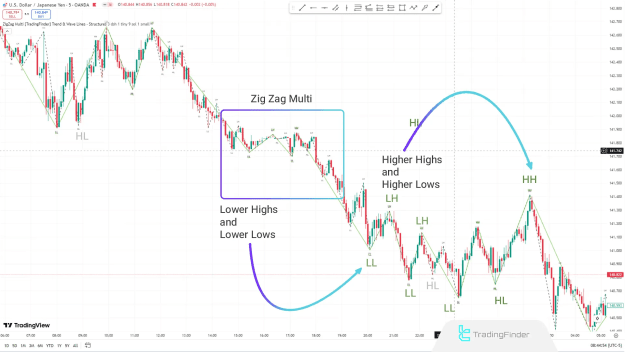
Downtrend Identification (USD/JPY Example)
On a 5-minute USD/JPY chart, the indicator marks Lower Highs (LH) and Lower Lows (LL), signaling a downtrend. This helps traders recognize bearish momentum and adjust their strategies accordingly.
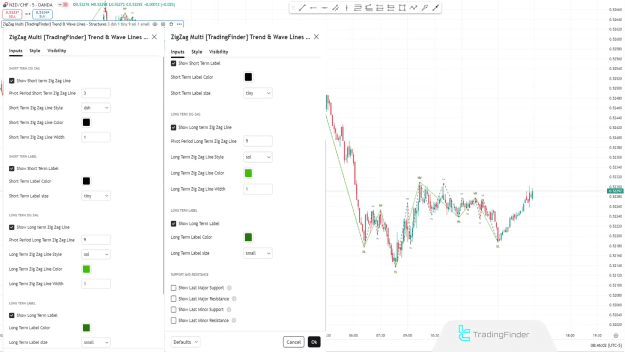
Customizable Indicator Settings
Short-Term Zigzag Configuration
- Show/Hide Short-Term Zigzag Line – Toggle visibility.
- Pivot Period Adjustment – Modify sensitivity for short-term swings.
- Line Style, Color & Width – Customize appearance for better clarity.
Long-Term Zigzag Configuration
- Show/Hide Long-Term Zigzag Line – Enable/disable long-term trend visualization.
- Pivot Period Adjustment – Set the threshold for major swing points.
- Line Customization – Adjust style, color, and thickness.
Labeling & Support/Resistance Options
- Show/Hide Labels (LL, LH, HH, HL) – Improve trend readability.
- Display Last Major/Minor Support & Resistance – Highlight key price levels.
Conclusion
The Zigzag Multi Indicator is an essential tool for traders seeking to identify trends, detect reversals, and apply advanced technical analysis techniques. Its flexibility across multiple timeframes and customizable settings make it suitable for various trading styles, including forex, commodities, and indices.
By leveraging this indicator, traders can:
- Spot trend continuations & reversals
- Improve Elliott Wave analysis
- Identify high-probability entry & exit points
Integrate the Zigzag Multi Indicator into your TradingView charts to refine your market analysis and optimize your trading strategy.