- Buy orders are marked in green, indicating strong demand zones.
- Sell orders are marked in red, highlighting supply zones where selling pressure may emerge.
When price revisits these unconsumed order blocks, traders can expect strong momentum shifts, making this tool invaluable for intraday, swing, and scalping strategies.
You can access the Indicator from this link:
https://tradingfinder.com/products/i...-block-finder/
You can access the Indicator on the TradingView website:
https://www.tradingview.com/script/M...ly-and-Demand/
Prop Firm DrawDown Protector : Prop Firm Capital Protection Expert MT5 |Forex Money Management: Forex Trade Management Expert MT5 | ICT Concepts Indicator MT5 |Smart Money Concepts Expert MT5 | Smart Money Trap Scanner |Get a free Expert Advisor license via Telegram and WhatsApp
Key Features of the OBF S&D Indicator
1. Identifies High-Probability Reversal Zones
The OBF S&D indicator detects order blocks—areas where institutional traders (smart money) have previously placed large orders. These zones act as support and resistance levels, often triggering sharp price movements upon retests.
2. Works Across Multiple Timeframes
Whether you trade on:
- M1-M5 (Scalping)
- M15-M30 (Intraday)
- H1-H4 (Swing Trading)
The indicator adapts seamlessly, providing actionable insights for different trading styles.
3. Customizable Alerts & Visual Enhancements
Traders can adjust settings such as:
- Order Block Refinement (to filter the most relevant zones)
- Demand & Supply Zone Colors (for better visibility)
- Alerts (for real-time notifications on breakouts or rejections)
How to Use the OBF S&D Indicator in Trading
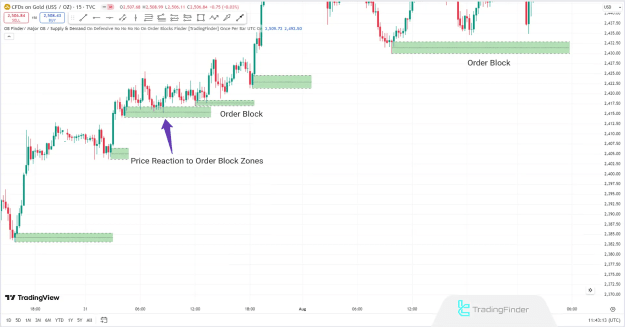
Bullish Order Blocks in an Uptrend
Example: GOLD CFD (15-Minute Chart)
- In an uptrend, the indicator highlights green demand zones where buyers are likely to step in.
- Each retest of these zones results in strong bullish reactions, confirming their validity as support levels.
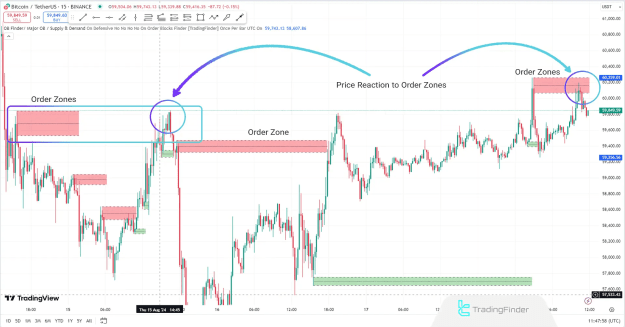
Bearish Order Blocks in a Downtrend
Example: BTC/USDT (15-Minute Chart)
- During pullbacks or trend reversals, the OBF S&D marks red supply zones where sellers dominate.
- Price reactions at these levels often lead to sharp declines, offering shorting opportunities.
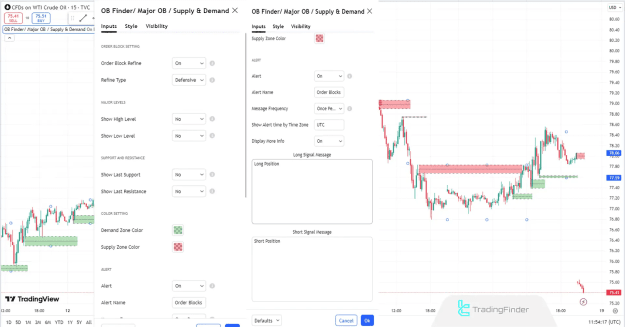
Indicator Settings & Customization
The OBF S&D allows traders to fine-tune its parameters for optimal performance:
- Order Block Refine – Filters the most significant zones.
- Show High/Low Levels – Displays key support/resistance areas.
- Alert Customization – Set notifications for breakouts or bounces.
- Zone Colors – Adjust demand (green) and supply (red) colors for clarity.
Why Traders Should Use the OBF S&D Indicator
- Accurate Identification of Smart Money Zones – Pinpoints where institutions place orders.
- Leading Signals – Helps anticipate reversals before they occur.
- Versatile for All Markets – Effective in Forex, Stocks, Indices, and Crypto.
- Enhances Price Action Strategies – Works well with ICT, Supply & Demand, and Order Flow concepts.
Final Thoughts
The Order Blocks Finder (OBF S&D) is a must-have tool for traders who follow smart money concepts and price action trading. By identifying high-probability order blocks, it provides an edge in spotting potential reversals and momentum shifts.
Whether you're a scalper, day trader, or swing trader, integrating this indicator into your strategy can significantly improve your trading precision.