Designed for multi-symbol and multi-timeframe scanning, this indicator provides real-time insights into deceptive market movements often targeted by smart money strategies.
You can access the Indicator from this link:
https://tradingfinder.com/products/i...-trap-scanner/
You can access the Indicator on the TradingView website:
https://www.tradingview.com/script/y...TradingFinder/
Prop Firm DrawDown Protector : Prop Firm Capital Protection Expert MT5 | Smart Money Trap Scanner | Forex Money Management: Forex Trade Management Expert MT5 | ICT Concepts Indicator MT5 |Smart Money Concepts Expert MT5 |Get a free Expert Advisor license via Telegram and WhatsApp
Key Features of the Smart Money Trap Scanner
- Detects fake structural breakouts and reversals
- Analyzes price retracements within the 0.618–1.0 Fibonacci range
- Supports multi-timeframe analysis and multi-asset markets
- Integrates liquidity-based trading logic and smart money concepts
- Sends real-time alerts based on strict entry criteria
Indicator Categories and Compatibility
- ICT TradingView Indicators
- Smart Money TradingView Indicators
- Liquidity TradingView Indicators
- Platforms: TradingView
- Skill Level: Advanced
- Type: Reversal Indicators
- Timeframe: Multi-timeframe
- Trading Style: Intraday
- Markets: Forex, Crypto, Stocks
How the Smart Money Trap Scanner Works
Market Structure and Key Level Identification
The scanner first identifies critical price levels, including swing highs/lows and valid support and resistance zones. These levels form the foundation for evaluating structural integrity and potential price manipulation.
Fake Breakout Recognition
When price breaches a significant level but returns to it within a maximum of five candles, the event is classified as a fake breakout. This is typically a sign of liquidity grabbing, a tactic often used to trigger stop-losses and collect orders.
Structural Reversal and Liquidity Confirmation
Upon a fake breakout, the scanner evaluates whether price returns to the original level and absorbs liquidity. If confirmed, this marks a high-probability reversal zone and supports potential trade execution.
Fibonacci-Based Retracement Analysis
After identifying a fake breakout, the scanner draws a Fibonacci retracement from the recent swing to the breakout point. If price retraces into the 0.618 to 1.0 range, it confirms a deep correction zone, commonly used by smart money for entries.
Time-Based Entry Filtering
The retracement must occur within a 10-candle window after the structural reversal. This condition ensures timely entry opportunities aligned with liquidity absorption patterns.
Alert System and Signal Filtering
The scanner only issues alerts if all of the following conditions are met:
- A valid fake breakout occurs
- Price returns to the breakout level
- Price enters the 0.618–1.0 Fibonacci zone
- All conditions are fulfilled within the defined timeframe
Alerts are customizable based on time zone, frequency, and preferred asset list.
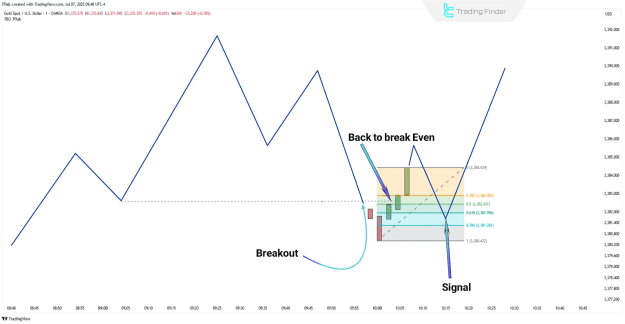
Smart Money Trap Scanner in Uptrends
In bullish conditions, if price dips below a swing low or support level and rapidly returns to it (within five candles), it is marked as a fake breakdown. The scanner then draws a Fibonacci from the recent high to the temporary low.
If price enters the deep retracement zone (0.618–1.0) within ten candles, a buy setup is confirmed based on smart money criteria.
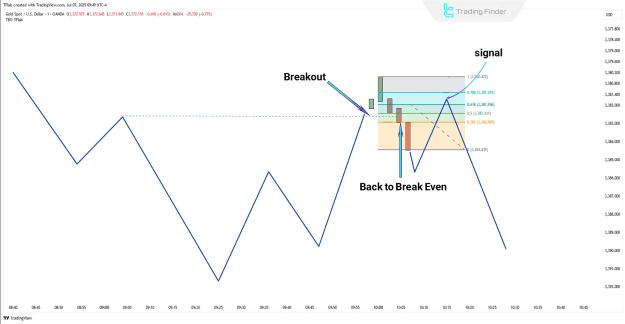
Smart Money Trap Scanner in Downtrends
In bearish trends, when price briefly breaks above a swing high or resistance level and returns below it within five candles, it is identified as a fake breakout. Fibonacci is drawn from the swing low to the false high to assess potential retracement depth.
A valid sell signal is generated when the price enters the 0.618 to 1.0 zone within the next ten candles, aligning with liquidity absorption and institutional distribution patterns.
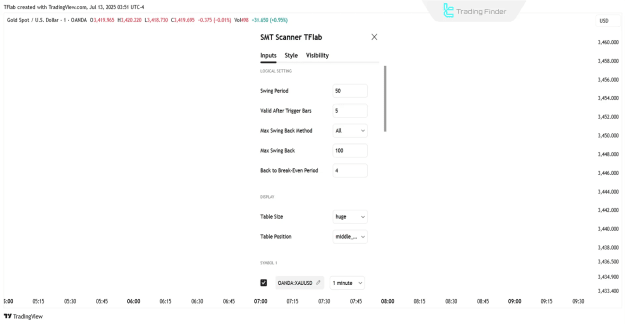
Configurable Settings of the Smart Money Trap Scanner
The Smart Money Trap Scanner includes several adjustable parameters to tailor its detection precision and visual output:
Logical Parameters
- Swing Period: Defines how price swings are calculated
- Valid After Trigger Bars: Sets the time validity post breakout
- Max Swing Back Method: Determines method for measuring retracement
- Max Swing Back: Limits the maximum swingback distance
Display Settings
- Table Size: Adjusts table visibility on the chart
- Table Position: Sets location of the information panel
Symbol and Timeframe
- Symbol: Select preferred trading asset
- Timeframe: Choose analysis intervals
Alert Configuration
- Enable Alert: Toggle on/off for alerts
- Message Frequency: Control how often notifications appear
- Time Zone Sync: Align alerts with local or exchange time
Conclusion
The Smart Money Trap Scanner serves as a powerful market filtering tool, meticulously designed to capture fake breakouts, assess liquidity zones, and confirm Fibonacci-based corrections—all critical elements in smart money trading strategies.
By filtering out noise and highlighting genuine institutional moves, this scanner significantly enhances trade accuracy and decision-making across Forex, crypto, and equity markets.