TP & SL Tool: Risk Reward Ratio Calculator RRR MT4 | Prop Firm Protector: Trade Assist Prop Firm Plus TF Expert MT4 | Money Management + DrawDown Protector: Trade Panel Prop Firm Drawdawn Limiter Pro MT4 |Get a free Expert Advisor license via Telegram and WhatsApp
- Overall trend direction
- Trend strength
- Dynamic support and resistance levels
- Optimal entry and exit points
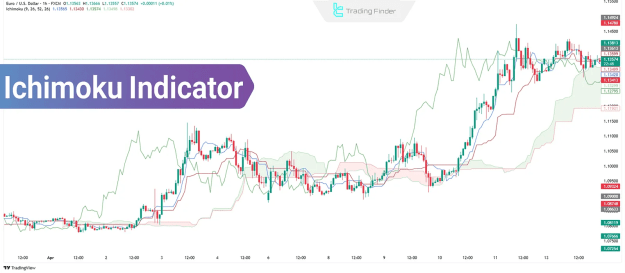
Its combination of moving averages and time-shifted elements distinguishes it from conventional indicators that rely solely on price data, making it particularly effective in trending markets such as Forex and cryptocurrencies.
The Origin of Ichimoku
Developed in the 1930s by Japanese journalist Goichi Hosoda, Ichimoku was introduced publicly in the 1960s after decades of rigorous testing and refinement. The term Ichimoku Kinko Hyo translates to “equilibrium chart at a glance,” reflecting its purpose of offering traders a quick and thorough market assessment.
Initially applied to Japanese equities, its robust structure has led to widespread adoption in global markets, especially among Forex traders seeking reliable trend-based analysis.
Key Benefits and Limitations
Advantages
- Offers a complete market analysis within a single framework
- Generates actionable buy and sell signals
- Detects potential market reversals early
- Applicable to all timeframes for multi-level strategy development
Disadvantages
- Generates delayed signals due to its structural formulation
- Less reliable in sideways or low-volatility market conditions
Core Components of Ichimoku
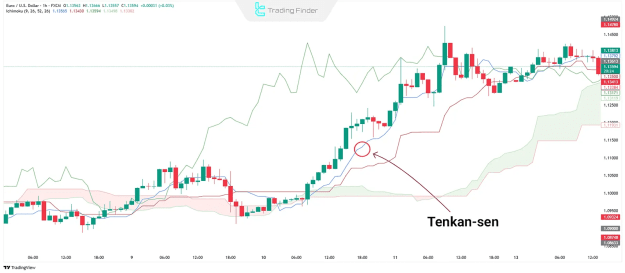
Tenkan-sen (Conversion Line)
- Calculated as the average of the highest high and lowest low over the past nine candles
- Indicates short-term trend direction and momentum
- Reacts rapidly to price fluctuations
- Generates cross signals with Kijun-sen
- Acts as dynamic short-term support or resistance during market consolidation
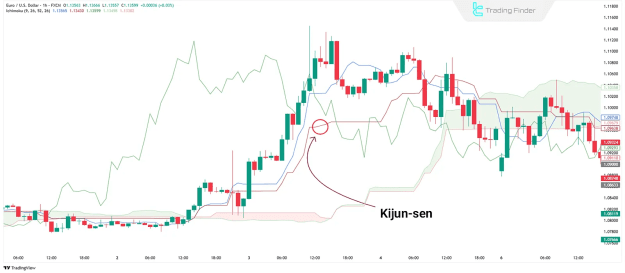
Kijun-sen (Base Line)
- Calculated as the average of the highest high and lowest low over the past 26 candles
- Reflects medium-term trend and market equilibrium
- Provides confirmation for trend continuation or reversal
- Serves as a strong dynamic support or resistance depending on price position
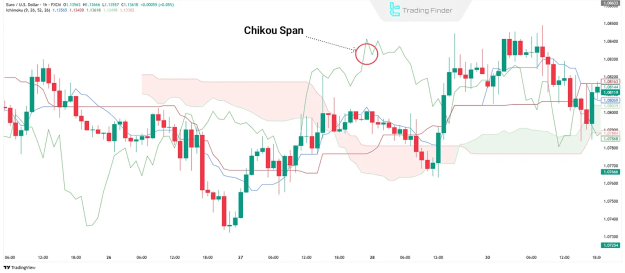
Chikou Span (Lagging Span)
- Plots the current closing price shifted 26 periods backward
- Compares current price with historical price levels to confirm trend strength
- Above current price: indicates bullish momentum
- Below current price: indicates bearish momentum
- Crossovers with previous candles may signal trend weakness or potential reversals
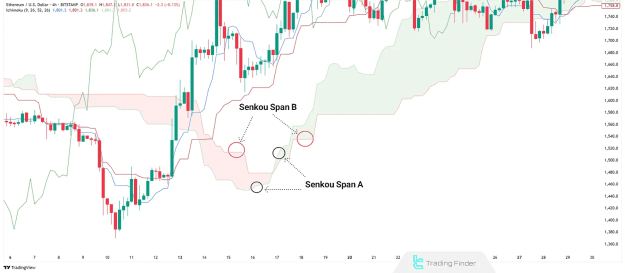
Senkou Span A (Leading Span A)
- Calculated as the average of Tenkan-sen and Kijun-sen, shifted 26 periods ahead
- Forms part of the Kumo cloud
- In uptrends, it acts as the cloud’s upper boundary; in downtrends, as the lower boundary
- Indicates the strength and direction of the prevailing trend
Senkou Span B (Leading Span B)
- Calculated as the average of the highest high and lowest low over the past 52 candles, shifted 26 periods forward
- Creates the other boundary of the Kumo cloud
- More stable than Senkou Span A, providing robust support or resistance in strong trends
- A flat Senkou Span B often signals consolidation zones and key price levels
Understanding the Kumo Cloud
The Kumo cloud is the area between Senkou Span A and Senkou Span B, projected 26 periods into the future. It is fundamental in assessing market structure and
trend confirmation:
- Span A above Span B: Bullish cloud, typically colored green or blue
- Span B above Span A: Bearish cloud, generally colored red or orange
Price Interaction with the Kumo Cloud
- Above the cloud: Indicates a bullish market, with the cloud acting as dynamic support
- Below the cloud: Signals a bearish market, with the cloud serving as dynamic resistance
- Inside the cloud: Suggests market indecision or ranging conditions
Cloud Thickness and Market Implications
- Thicker clouds: Indicate strong trends and reliable support/resistance
- Thinner clouds: Suggest weaker trends and a higher potential for price breakouts
Practical Ichimoku Trading Strategies
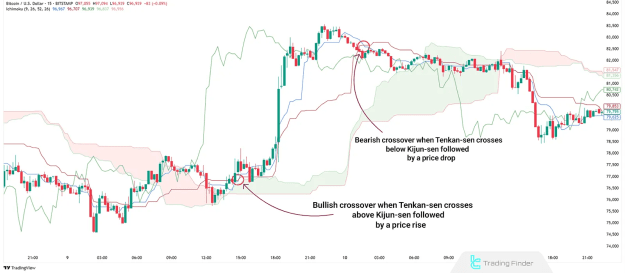
Crossover Strategy
Tenkan-sen and Kijun-sen Cross
- Bullish cross: Tenkan-sen crosses above Kijun-sen, indicating a potential upward reversal
- Bearish cross: Tenkan-sen crosses below Kijun-sen, suggesting a downward trend reversal
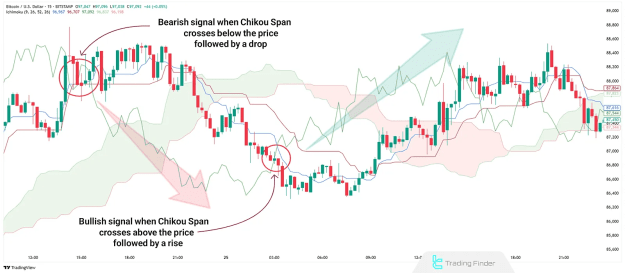
Chikou Span Cross Strategy
- Bullish signal: Chikou Span crosses above price from below, confirming an upward trend
- Bearish signal: Chikou Span crosses below price from above, confirming a downward trend
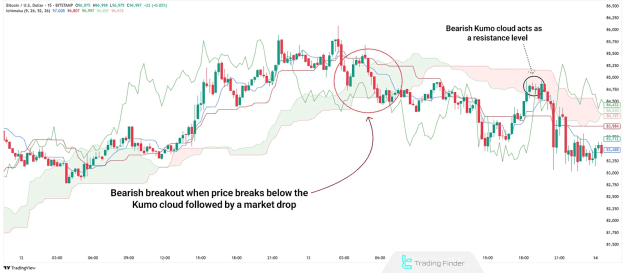
Kumo Breakout Strategy
Bullish Kumo Breakout
- Occurs when price breaks above the cloud, indicating a transition to an uptrend
- The cloud then acts as dynamic support for the new trend
Bearish Kumo Breakout
- Occurs when price breaks below the cloud, indicating a shift to a downtrend
- The cloud then acts as dynamic resistance, capping upward movements
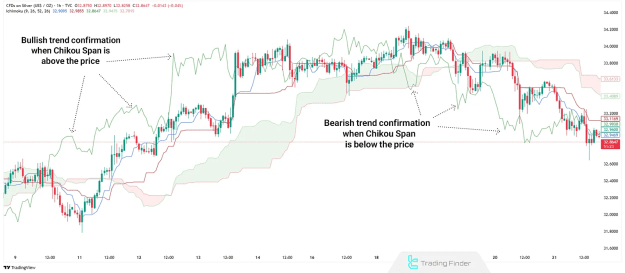
Chikou Span Trend Confirmation
- Above price: Confirms strong bullish momentum
- Below price: Confirms bearish momentum and trend strength
Chikou Span Trend Reversal
- Crosses from below to above: Indicates potential bullish reversal
- Crosses from above to below: Suggests potential bearish reversal
Bermuda Phenomenon in Ichimoku
The “Bermuda” phenomenon occurs when a small cloud forms without price interaction. This untouched area often acts as a magnetic zone, attracting price action and serving as a strategic target level across timeframes.
Advanced Ichimoku Application Tips
Multi-Timeframe Analysis
- Analyze primary trends on higher timeframes for strategic planning
- Identify precise entry and exit points on lower timeframes aligned with major trends
Integrating Ichimoku with Price Action
- Enhance Ichimoku signals by validating them with price action patterns
- For example, a buy signal aligned with a bullish engulfing pattern or a head and shoulders reversal increases reliability
Conclusion
Ichimoku offers traders a holistic view of the market, integrating five critical components to analyze trend direction, strength, support and resistance, and potential entry and exit points within a single framework. Its combination of moving averages, time-shifted calculations, and the Kumo cloud makes it an indispensable tool for professional traders navigating volatile markets such as Forex and cryptocurrencies.