TP & SL Tool: Risk Reward Ratio Calculator RRR MT4 | Prop Firm Protector: Trade Assist Prop Firm Plus TF Expert MT4 | Money Management + DrawDown Protector: Trade Panel Prop Firm Drawdawn Limiter Pro MT4 |Get a free Expert Advisor license via Telegram and WhatsApp
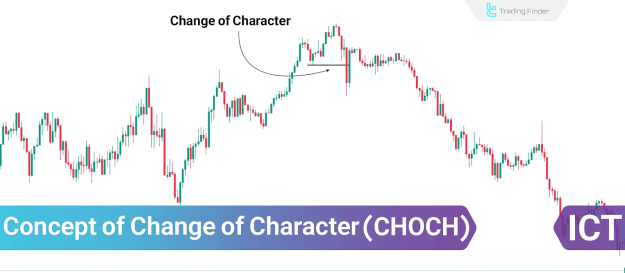
Concept of Change of Character (CHOCH) in the Market
CHOCH represents a transition from a prevailing trend (bullish or bearish) to a new trend direction, reflecting shifts in liquidity positioning and trader behaviour. This concept is crucial for identifying the end of the current trend and the beginning of a new one.
Multiple CHOCH Formations in the Market
- CHOCH formations appear at key transitional points in market phases such as accumulation, uptrend, distribution, and downtrend.
- They indicate psychological changes among buyers and sellers, altering the broader market structure.
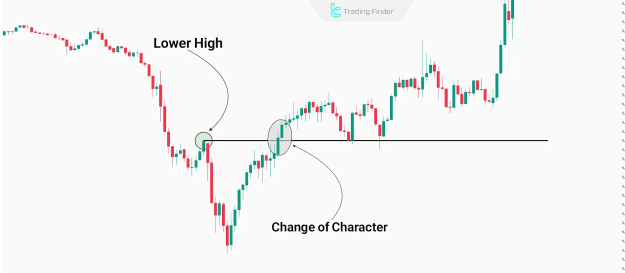
Bearish CHOCH
In a bullish trend, a bearish CHOCH occurs when the market structure shifts from forming Higher Highs (HH) and Higher Lows (HL) to forming Lower Lows (LL) and Lower Highs (LH). This suggests weakening buyer strength and the emergence of seller dominance.
Key Features
- Failure to create a new high
- Break below the previous low
- Often accompanied by rising volume and a break of significant support levels
Example of Bearish CHOCH
- Scenario: Price fails to form a new high in an uptrend and breaks below the previous low.
- Signal: Market structure transitions from HH & HL to LL & LH, indicating a potential reversal to bearish trend.
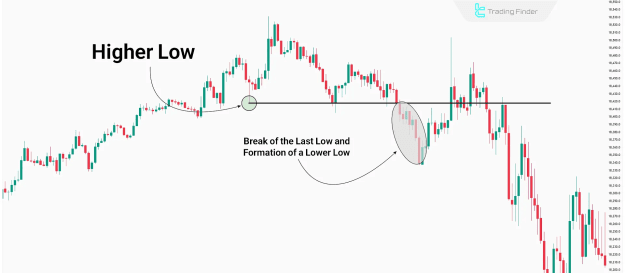
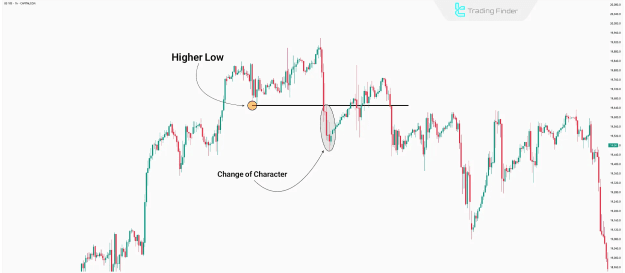
Bullish CHOCH
In a bearish trend, a bullish CHOCH forms when the market structure transitions from Lower Lows (LL) and Lower Highs (LH) to Higher Highs (HH) and Higher Lows (HL). This indicates that sellers are losing control while buyers begin to dominate the market.
Key Features
- Break of a significant resistance level
- Rising volume during the structural shift
- Confirmation often occurs near order block zones
Example of Bullish CHOCH
- Scenario: Price breaks above the last lower high and forms HH & HL.
- Signal: Market structure transitions from bearish to bullish, signalling a potential uptrend.
How to Identify CHOCH in Trading
- The first step is to understand the overall market structure and its price movement phases. CHOCH typically forms at transitional points between accumulation, uptrend, distribution, and downtrend.
Key Factors for Detecting CHOCH
- Price Behaviour Analysis: Identify swing highs and lows and monitor their changes.
- Support and Resistance Zones: Breakouts often indicate structural shifts.
- Volume Analysis: Significant volume changes confirm CHOCH formation.
- Imbalance Zones and Order Blocks: Mark major institutional entries or exits.
Tips for Better Recognition
- Apply top-down analysis from higher to lower timeframes.
- Analyse volume behaviour during CHOCH formation.
- Examine price action at key support and resistance levels.
- Use complementary tools and indicators for confirmation.
Best Timeframe to Identify CHOCH
- Using a top-down approach enhances CHOCH identification accuracy:
- Higher Timeframes (4H, 1H, 30M): Determine the major trend direction and swing structure.
- Mid-Level Timeframes (1H, 30M): Validate swing structures.
- Lower Timeframes (30M, 15M): Confirm structural breaks for precise entries.
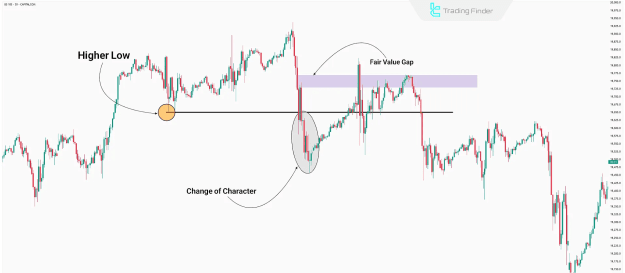
CHOCH + FVG Trading Setup
Combining CHOCH with Fair Value Gaps (FVG) creates high-probability trading setups.
Steps for Trading CHOCH + FVG
- Identify CHOCH in higher timeframes (4H, 1H, or 30M).
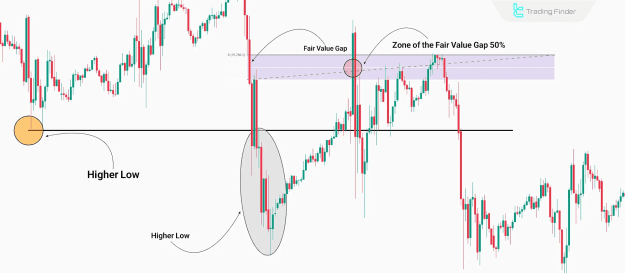
- Spot FVG in lower timeframes (30M or 15M).
- Determine Entry: Use the 50% level of the FVG for precise entries.
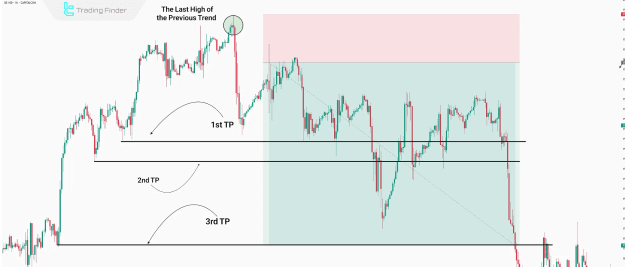
- Target: Previous swing lows act as support zones and profit targets.
- Stop-Loss: Place above the last high of the previous trend.
Example
- CHOCH Formation: Detected on a 1H NASDAQ chart.
- FVG Detection: Confirmed on a 30M chart.
- Entry: 50% mark of the FVG zone.
- Take Profit & Stop-Loss: Set based on previous structural levels.
Conclusion
- CHOCH in ICT occurs at trend endpoints, indicating a shift from bullish to bearish structures or vice versa. Its accurate identification requires comprehensive analysis of market structure, volume behaviour, and liquidity zones, enabling traders to capitalise on emerging trend opportunities efficiently.