This strategy revolves around the Liquidity Sweep + Reversal concept, where price first grabs liquidity and then reverses in the direction of the prevailing trend.
TP & SL Tool: Risk Reward Ratio Calculator RRR MT4 | Prop Firm Protector: Trade Assist Prop Firm Plus TF Expert MT4 | Money Management + DrawDown Protector: Trade Panel Prop Firm Drawdawn Limiter Pro MT4 |Get a free Expert Advisor license via Telegram and WhatsApp
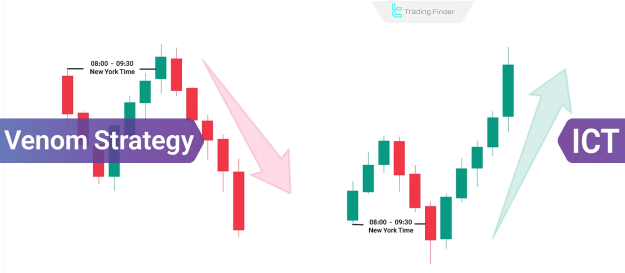
Learning the Venom Strategy in ICT Style
The Venom strategy is tailored for New York session intraday setups, specifically focusing on price behavior in relation to early-session liquidity.
Core Time Window
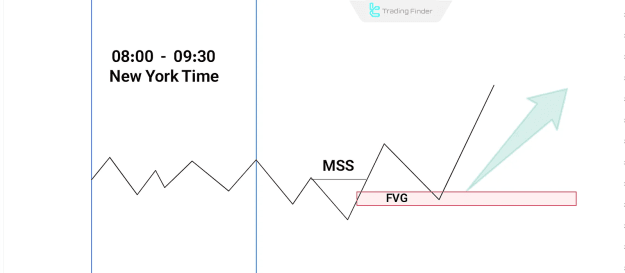
- Key Timing: 08:00 AM to 09:30 AM (New York Time)
- This range establishes the Initial Balance, a critical area for identifying liquidity and directional bias.
Strategic Process
- The price typically breaks one boundary of this initial range to collect liquidity.
- A reversal setup is confirmed once key structure signals align.
- Entries and exits are defined based on Fair Value Gaps (FVG), Market Structure Shift (MSS), and Change in State of Delivery (CISD).
Key ICT Concepts Used in Venom Strategy
The Venom model integrates several foundational ICT concepts:
- Liquidity Sweep: False break of a predefined high/low to trigger orders.
- Fair Value Gap (FVG): Imbalance zones used for trade entries.
- Market Structure Shift (MSS): Structural change confirming a new direction.
- Change in State of Delivery (CISD): Momentum and delivery shift to validate trade direction.
Time & Structure Logic Behind Venom Strategy
The Initial Balance Range, formed between 08:00 and 09:30 AM NYT, is vital in identifying:
- False breakouts (liquidity grabs)
- Confirmed structural shifts
- High-probability entry zones
Trade execution only occurs when price action confirms alignment between liquidity zones and market structure.
Types of ICT Venom Strategy Models
The Venom strategy operates in two main market contexts:
ICT Venom Bullish Model
- Initial range: 08:00–09:30 AM marks the session's high/low.
- Setup:
- Price breaks the lower boundary (sell-side liquidity sweep).
- Followed by MSS or CISD, signaling a bullish reversal.
- Entry is taken when the price returns to a demand zone or PD array.
- Stop-Loss: Slightly below the false break low.
- Targets:
- Initial range high
- Daily or weekly high
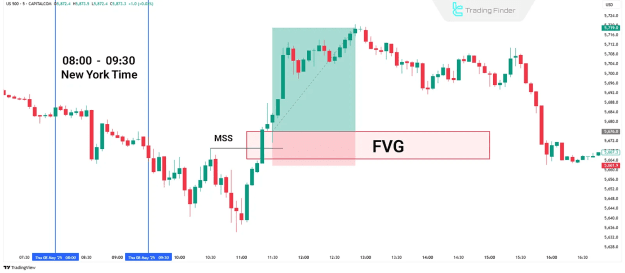
Bullish Example:
On the US500 chart, price dips below the 90-minute low post-open, triggers MSS/CISD, and rebounds from an FVG zone. A long position is entered with risk managed below the false break and profit taken at the daily high.
ICT Venom Bearish Model
- Initial range: High and low defined before 09:30 AM.
- Setup:
- Price breaks the upper boundary (buy-side liquidity sweep).
- MSS or CISD appears, confirming a bearish reversal.
- Entry occurs when price retraces to a supply zone or higher PD arrays.
- Stop-Loss: Slightly above the false break high.
- Targets:
- Initial range low
- Lower support levels
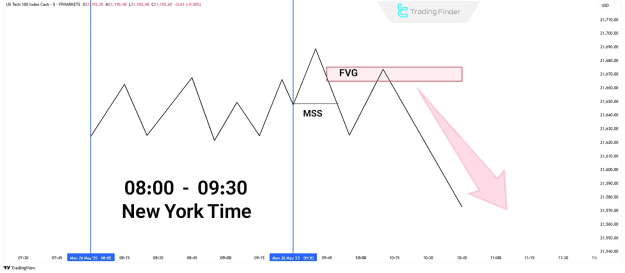
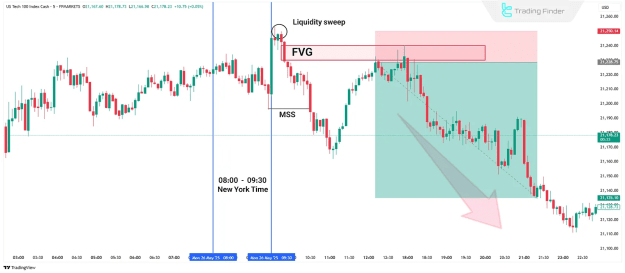
Bearish Example:
Using the US100 (NASDAQ) chart, price briefly exceeds the early range high after the open, then reverses after MSS/CISD. Entry is made at a retrace into FVG with a short position, targeting the daily low.
Conclusion
The ICT Venom Strategy is a structured and efficient model for intraday trading, designed around institutional liquidity mechanics. It emphasizes:
- False breakouts and liquidity collection
- Smart money alignment and timing
- Market structure validation
- Accurate entry/exit planning using FVGs and PD arrays
Traders applying the Venom strategy benefit from a refined view of market dynamics, filtering genuine price action from noise. It is not merely a method of trade execution—it is a model for analyzing and understanding liquidity flow within the New York session.