TP & SL Tool: Risk Reward Ratio Calculator RRR MT5 | Prop Firm Protector: Trade Assist Prop Firm Plus TF Expert MT5 | Money Management + DrawDown Protector: Trade Panel Prop Firm Drawdawn Limiter Pro MT5 |Get a free Expert Advisor license via Telegram and WhatsApp
What Is the Head and Shoulders Pattern?
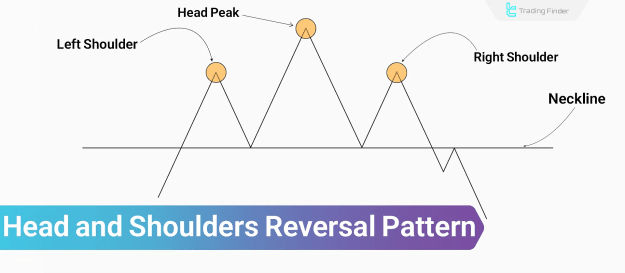
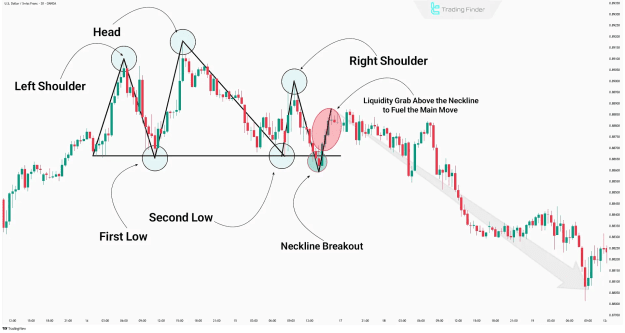
The head and shoulders pattern is a bearish reversal formation that appears at the end of an uptrend. It consists of:
- A left shoulder: The first peak following a bullish movement.
- A head: A higher peak, marking the final push of the buyers.
- A right shoulder: A lower peak than the head, indicating declining buying pressure.
- A neckline: A support level connecting the lows between the shoulders and head.
The inability of price to form new highs during this pattern signals a potential shift in market sentiment.
Key Characteristics:
- Forms across all financial markets (Forex, crypto, stocks)
- Appears in various timeframes
- Often followed by a significant trend reversal
Advantages and Disadvantages of the Head and Shoulders Pattern
Advantages:
- Effective in identifying structural weaknesses in prevailing trends
- Applicable across multiple timeframes and asset classes
- Clear invalidation and breakout levels
- Allows for well-defined stop loss and take profit targets
Disadvantages:
- May generate false signals in highly volatile conditions
- Requires confirmation through volume or technical indicators
- Relies heavily on the accuracy of the neckline
- Sensitive to irregular shoulder formation or sloped necklines
Components of the Head and Shoulders Pattern
Each part of the head and shoulders pattern plays a critical role in identifying a reversal:
- Left Shoulder: Occurs after a strong uptrend; typically accompanied by high trading volume.
- Head: The highest peak, where buyers attempt but fail to maintain momentum.
- Right Shoulder: Lower than the head; often formed with lower liquidity.
- Neckline: Acts as a support line; can be horizontal or sloped based on price action.
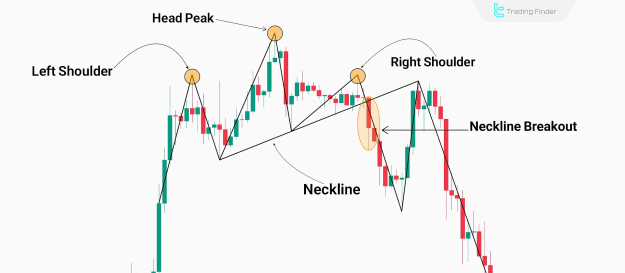
How to Trade the Head and Shoulders Pattern
The pattern becomes actionable only after the neckline is clearly broken and price sustains below it.
Entry Methods:
- Aggressive Entry: Execute the trade immediately after the neckline breaks; stop loss is set above the right shoulder.
- Conservative Entry: Wait for a pullback to the neckline and confirm with candlestick or momentum signals.
Stop Loss and Take Profit Placement:
- Take Profit: Measured by projecting the distance between the head and neckline downward from the breakout point.
- Stop Loss Options:
- Above the right shoulder (lower risk-reward but safer)
- Above the breakout candle (higher reward but riskier)
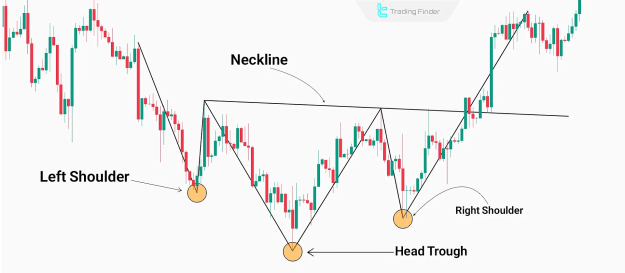
Inverse Head and Shoulders Pattern
The inverse head and shoulders pattern signals a bullish reversal and forms at the end of a downtrend. It mirrors the classic structure but with troughs instead of peaks:
- Left Shoulder: Initial low after a downtrend
- Head: Lower trough indicating peak selling pressure
- Right Shoulder: Higher low, reflecting seller exhaustion
- Neckline: Resistance level; breakout signals bullish momentum
A volume surge during the neckline breakout adds to the pattern's credibility.
Key Factors for Validating the Pattern
To increase the accuracy of the head and shoulders pattern, consider the following elements:
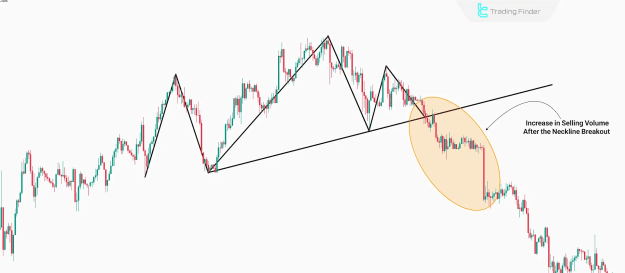
Neckline Slope:
- Downward slope: Stronger bearish signal
- Upward slope: Reduces pattern reliability
Trading Volume:
- High at the start, gradually declining
- Lowest during the right shoulder formation
- Volume spike on breakout confirms signal strength
Shoulder Symmetry:
- Minor variations are acceptable
- Closer symmetry in height and time duration increases reliability
Pre-Breakout Price Behavior:
- Weak upward momentum before breakout adds validity
- Tight ranges and consolidations indicate selling pressure
Breakout Confirmation:
- RSI crossing below 50 post-breakout confirms weakening trend
- Price must stabilize below neckline for confirmation
- Long wicks without close below neckline signal weak breakout
Liquidity Dynamics Within the Pattern
Before the breakout, liquidity often accumulates around:
- Right shoulder
- Neckline zone
These areas attract stop-hunting and false breakouts by larger market participants. Recognizing these traps is essential for avoiding premature entries.
Evaluating the Pattern’s Validity
Beyond visual structure, context is critical. Invalid patterns typically exhibit:
- Imbalanced or rapidly formed right shoulder
- Formation within sideways trends
- Absence of confluence with other market signals
Traders must differentiate between structurally sound patterns and those formed under non-ideal market conditions.
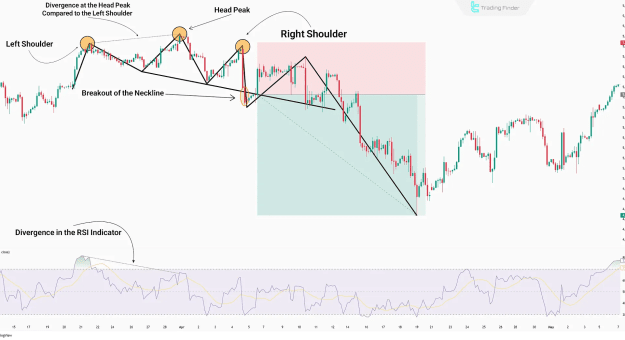
Strategy: Combining Head and Shoulders with RSI Indicator
A multi-confirmation strategy can significantly improve reliability by aligning structural analysis with momentum indicators.
Step 1: Confirm Pattern Structure
- Fully developed head and shoulders pattern
- Preferably a downward-sloping neckline
Step 2: RSI Divergence on Right Shoulder
- Look for bearish divergence between the head and right shoulder on RSI
- Lower RSI peak signals momentum exhaustion
Step 3: RSI Cross Below 50 and Neckline Break
- RSI dropping below 50 level concurrent with a neckline break strengthens the signal
Step 4: Confirm Entry After Retest
- Price must hold below the neckline
- Entry is valid only if RSI and price action confirm seller dominance
Conclusion
The head and shoulders pattern remains one of the most effective and widely used reversal indicators in technical analysis. Its success lies in:
- Careful analysis of price structure and volume behavior
- Proper identification of the pattern’s components
- Strategic combination with momentum tools like the RSI
Used correctly, this pattern provides a powerful edge in anticipating trend reversals and positioning trades with higher confidence.