TP & SL Tool: Risk Reward Ratio Calculator RRR MT4 | Prop Firm Protector: Trade Assist Prop Firm Plus TF Expert MT4 | Money Management + DrawDown Protector: Trade Panel Prop Firm Drawdawn Limiter Pro MT4 |Get a free Expert Advisor license via Telegram and WhatsApp
What Is Momentum?
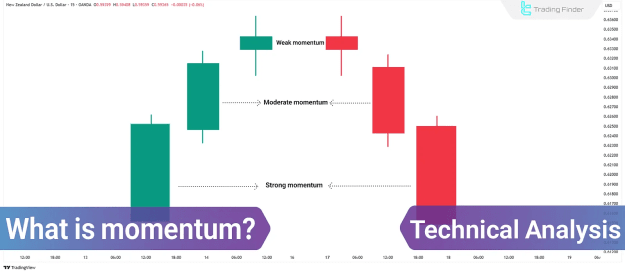
Momentum refers to the rate at which the price of an asset moves in a particular direction over a specific time frame. It measures both the strength and velocity of price action, helping analysts determine whether a trend is sustainable or at risk of reversal.
Even when price is trending, the absence of momentum may signal a potential correction or reversal. Therefore, momentum plays a critical role in validating the reliability of ongoing price movements.
How Momentum Forms in Technical Analysis
Momentum is derived from price behavior and is typically quantified through indicators. It reflects the imbalance between buying and selling pressure:
- Rising momentum indicates strong buying interest and increasing demand.
- Falling momentum signals increasing supply and selling pressure.
Momentum indicators are primarily used to:
- Identify strong or weak trends;
- Predict potential trend reversals;
- Avoid false entries during low-volume or range-bound phases.
Advantages and Limitations of Momentum Analysis
Momentum indicators provide several strategic benefits, yet they also possess some limitations, especially in non-trending environments.
Benefits of Momentum Analysis:
- Identifies strong and sustainable market trends
- Helps detect early signs of trend reversals
- Effective for short to medium-term trading strategies
Limitations of Momentum Analysis:
- Less reliable during sideways or ranging market conditions
- Vulnerable to false signals in short timeframes
- Often requires confirmation from other technical tools
Importance and Applications of Momentum in Market Analysis
Momentum is a vital tool to determine whether current market forces—specifically supply and demand—are capable of sustaining the existing trend. Momentum analysis helps traders in the following areas:
- Entering trades in alignment with strong trends
- Assessing the weakening or continuation of a trend
- Detecting divergences that may signal reversals
- Recognizing overbought and oversold zones to refine entry and exit points
Key Momentum Indicators
Various technical indicators are used to measure momentum. Each employs different mathematical models to provide insight into market strength.
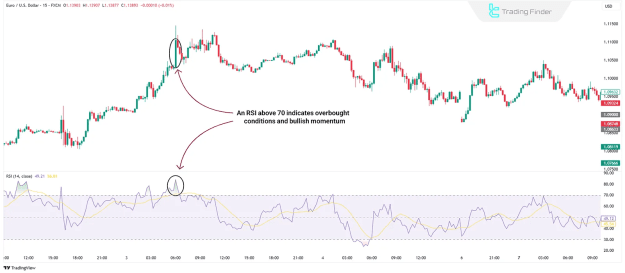
Relative Strength Index (RSI)
- Measures the magnitude of recent price changes to determine overbought or oversold conditions
- Values range between 0 and 100, with levels above 70 considered overbought and below 30 oversold
- Divergence between RSI and price may indicate a possible trend reversal
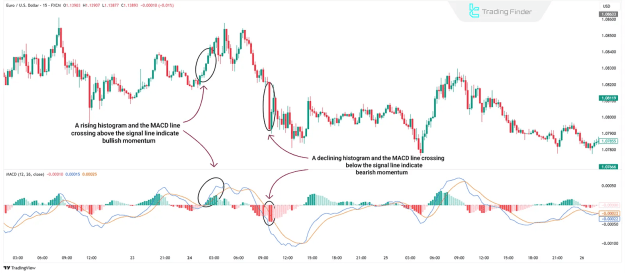
MACD (Moving Average Convergence Divergence)
- Calculates the relationship between two exponential moving averages
- When the MACD line crosses the signal line, it suggests changes in momentum direction
- The MACD histogram visualizes the strength of this momentum
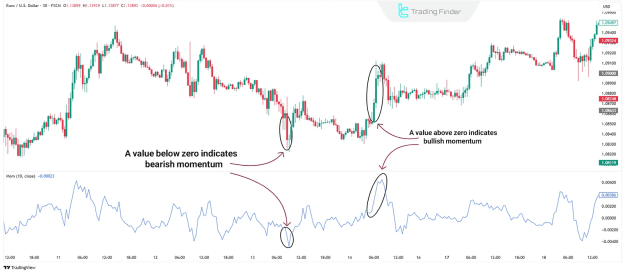
Momentum Indicator
- Measures the rate of price change directly
- Values above zero indicate bullish momentum
- Values below zero represent bearish momentum
Types of Momentum in Technical Analysis
Momentum can manifest in different forms, each offering unique signals based on the alignment or conflict between price action and indicators.
Confirmation Momentum
- Occurs when both price and the momentum indicator move in the same direction
- Reinforces the current trend and increases confidence in trend continuation
Contrary Momentum
- Arises when price movement contradicts the direction of the momentum indicator
- Known as divergence and often indicates weakening strength and the potential for reversal
Momentum as a Trend Predictor
Momentum serves as a leading indicator for trend shifts. Typically, changes in momentum occur before the actual price movement, making it a valuable tool for forecasting market direction.
- Positive Divergence: Price creates a lower low, but the momentum indicator forms a higher low — signaling decreasing selling pressure and a likely upward reversal
- Negative Divergence: Price hits a new high, while the momentum indicator shows a lower high — indicating potential exhaustion in the uptrend
Forms of Momentum in Price Candles
Momentum can take on three primary forms based on market direction and strength.
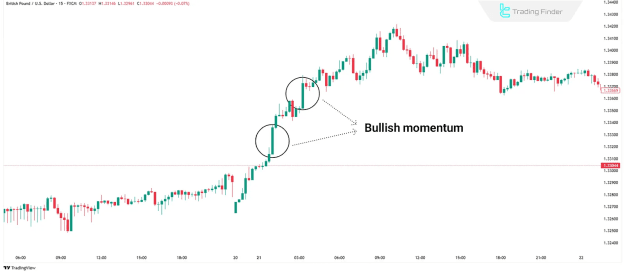
Bullish Momentum
- Characterized by accelerating upward price movement
- Market forms consistent higher highs and higher lows
- Momentum indicators often enter overbought zones
- Suggests strong buyer control and continuation of the uptrend
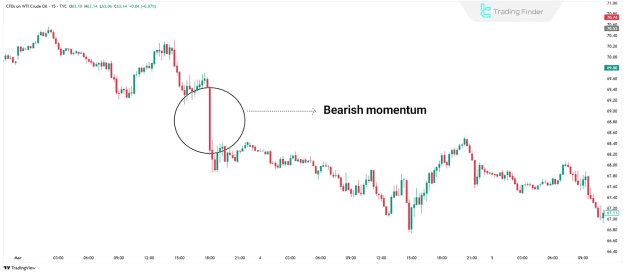
Bearish Momentum
- Seen during sustained downward price movement
- Consistent lower lows and lower highs are observed
- Momentum indicators frequently enter oversold territory
- Implies strong selling pressure and potential trend continuation
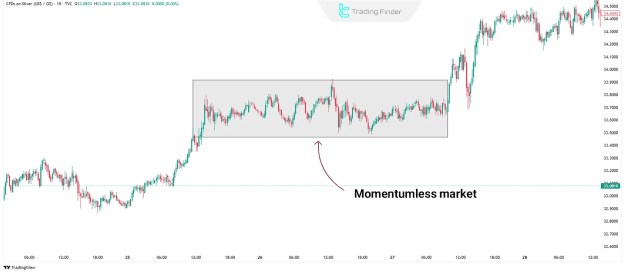
Neutral or Sideways Momentum
- Occurs in range-bound or consolidating markets
- Price oscillates within a narrow band without forming new highs or lows
- Momentum indicators remain flat or centered
- Reflects market indecision with no clear trend direction
Identifying Exit Points Using Momentum
Momentum indicators are valuable for determining optimal exit strategies in both bullish and bearish market phases.
- A decline in momentum or the appearance of divergence may signal an appropriate time to exit a long position and secure profits
- For short positions, weakening bearish momentum may indicate that the downtrend is losing strength and a reversal could follow
Conclusion
Momentum is a powerful concept in technical analysis that helps evaluate the strength behind price trends. By analyzing momentum, traders can enhance their ability to forecast trend continuation or reversal.
However, momentum analysis should not be used in isolation. Combining momentum with price action, volume analysis, and key support/resistance levels provides a more comprehensive view of market dynamics and helps improve decision-making accuracy.