TP & SL Tool: Risk Reward Ratio Calculator RRR MT5 | Prop Firm Protector: Trade Assist Prop Firm Plus TF Expert MT5 | Money Management + DrawDown Protector: Trade Panel Prop Firm Drawdawn Limiter Pro MT5 |Get a free Expert Advisor license via Telegram and WhatsApp
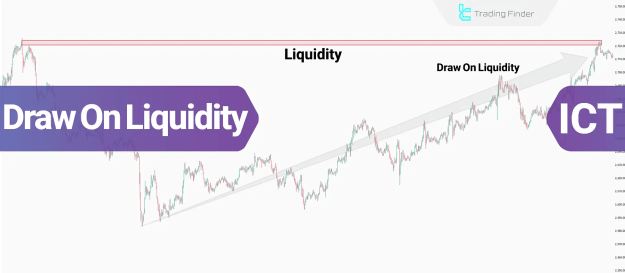
Understanding Draw On Liquidity (DOL)
Price does not move randomly; instead, it is magnetized by liquidity pools positioned at key technical levels. These areas include:
- Previous highs and lows
- Zones of equal highs and lows
- Institutional support and resistance
- Order blocks
- Fair Value Gaps (FVG)
The Draw On Liquidity (DOL) framework in ICT trading emphasizes that price moves into these liquidity areas to collect orders, enabling a stronger and more sustainable continuation of the trend.
Types of Market Liquidity
Liquidity in the foreign exchange market exists in two primary forms. Understanding each type is essential for interpreting and anticipating Draw On Liquidity setups.
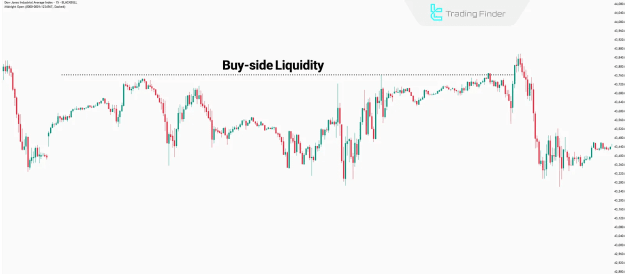
Buy-Side Liquidity
Buy-side liquidity refers to the cluster of buy stop orders and stop-losses from short positions, generally located above the current market price. These are frequently situated at:
- Swing highs
- Resistance levels
- Breakout zones
Key Characteristics:
- Positioned above price
- Created by retail stop-loss clusters and breakout traders
- Often exploited in bullish Draw On Liquidity moves
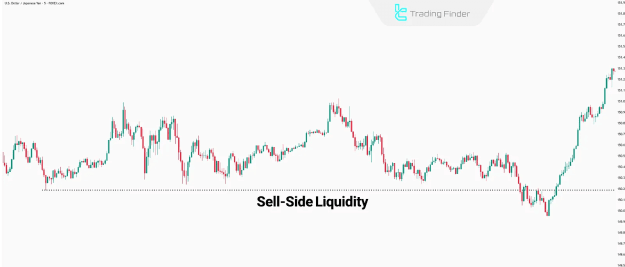
Sell-Side Liquidity
Sell-side liquidity accumulates below the current price level. It consists of sell stop orders and stop-losses of long positions. These are commonly found near:
- Swing lows
- Key support zones
- Psychological price levels
Key Characteristics:
- Positioned below price
- Originates from retail long trades
- Typically targeted during bearish Draw On Liquidity moves
Identifying Draw On Liquidity Movements
Correct identification of Draw On Liquidity moves involves detecting high-probability liquidity zones where price is likely to react. These zones serve as magnets for price, especially when aligned with institutional trading models.
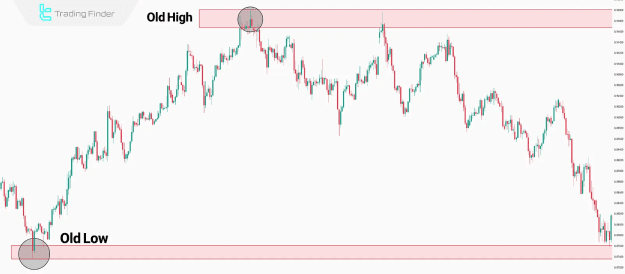
Old Highs and Lows
These are significant swing points where the price previously reversed. They often act as prime liquidity targets due to the clustering of stop-loss orders.
- Frequently attract liquidity-based price moves
- Often indicate potential reversals or continuation zones
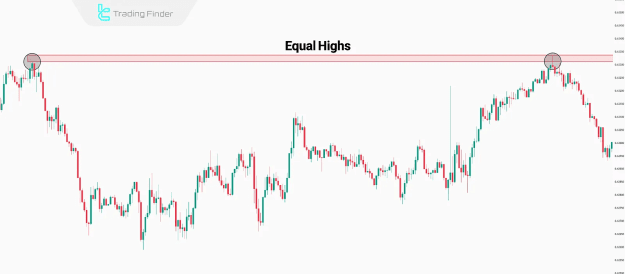
Equal Highs and Lows
Equal highs and lows form when price repeatedly tests the same level. These structures become liquidity traps as retail traders place their stop orders just beyond these zones.
- Reflect market indecision or accumulation
- Provide clean targets for liquidity grabs
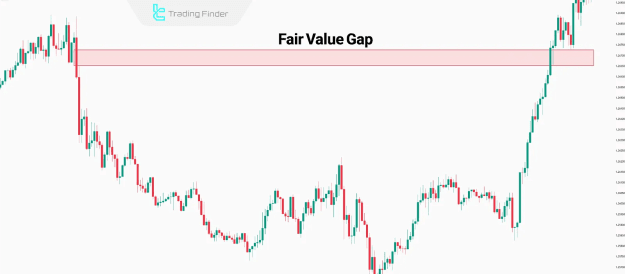
Fair Value Gap (FVG)
A Fair Value Gap represents an inefficiency or imbalance between buying and selling pressure. It appears as a rapid move leaving a gap between candlesticks.
- Serves as a high-probability zone for price revisits
- Often aligned with institutional order flow strategies
- A common area for liquidity collection and price mitigation
Advantages and Challenges of the DOL Strategy
Applying Draw On Liquidity analysis can significantly enhance trading precision. However, the methodology requires a sound understanding of market structure and liquidity behavior.
Advantages:
- Enables more accurate trade entries
- Reduces slippage through liquidity-based execution
- Improves stop loss and take profit placement
- Aligns trades with institutional order flow
- Enhances timing of entries and exits
- Minimizes stop-hunt exposure
Challenges:
- Requires in-depth understanding of liquidity dynamics
- Susceptible to fake breakouts and liquidity traps
- Risk of premature entries before full liquidity is tapped
- Identification of liquidity zones on lower timeframes is complex
- News events can disrupt liquidity flow and invalidate setups
- Difficult to distinguish valid vs. invalid liquidity pools without experience
Conclusion
The Draw On Liquidity (DOL) concept in ICT trading represents a core principle in understanding how institutional traders influence market movements. Recognizing liquidity zones—such as old highs and lows, equal highs and lows, and Fair Value Gaps—provides valuable insight into likely price targets.
Despite the potential for higher precision and improved trade outcomes, employing Draw On Liquidity strategies necessitates a robust grasp of liquidity mechanics and market structure. Traders must remain vigilant to avoid pitfalls such as false breakouts and ineffective liquidity mapping.