- Market prices reflect all available information
- Price movements tend to follow identifiable patterns
- Historical price action often repeats itself
This framework proves equally effective across diverse financial instruments including currency pairs, equities, cryptocurrencies, and commodity futures.
TP & SL Tool: Risk Reward Ratio Calculator RRR MT4 | Prop Firm Protector: Trade Assist Prop Firm Plus TF Expert MT4 | Money Management + DrawDown Protector: Trade Panel Prop Firm Drawdawn Limiter Pro MT4 |Get a free Expert Advisor license via Telegram and WhatsApp
Core Tenets of Technical Evaluation
The methodology rests on several foundational pillars:
- Price Pattern Recognition: Identification of recurring formations that signal trend continuations or reversals
- Trend Dynamics Analysis: Evaluation of market direction through sequential highs and lows
- Support/Resistance Framework: Mapping critical price levels where supply/demand imbalances occur
- Technical Indicator Integration: Utilizing mathematical derivatives of price/volume data
Advantages and Limitations of Technical Methodology
Strategic Benefits
- Enables precise identification of optimal trade entry/exit points
- Facilitates multi-timeframe analysis for comprehensive market perspective
- Provides objective criteria for risk/reward assessment
- Applicable across all liquid financial markets
- Complements fundamental analysis when combined judiciously
Inherent Constraints
- Potential for false signals during low-liquidity conditions
- Requires substantial experience for accurate interpretation
- Indicator-based approaches may lag real-time price action
- Susceptible to emotional decision-making without proper discipline
- Less effective during fundamental shock events
Essential Components of Technical Analysis
Price Pattern Classification
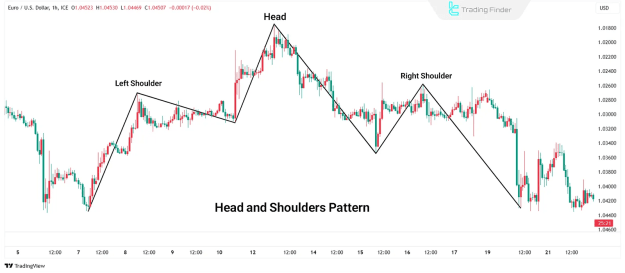
Reversal Formations:
- Head and Shoulders patterns
- Double/Triple Top/Bottom structures
- Key Reversal Candlesticks
Continuation Patterns:
- Bullish/Bearish Flags and Pennants
- Symmetrical/Ascending/Descending Triangles
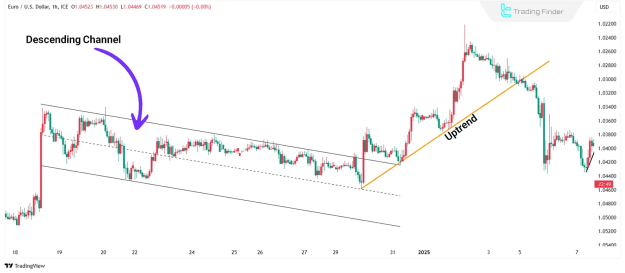
- Price Channel Developments
Trend Analysis Framework
- Uptrend Definition: Sequence of higher highs and higher lows
- Downtrend Identification: Series of lower highs and lower lows
- Range-Bound Conditions: Price oscillation between horizontal boundaries
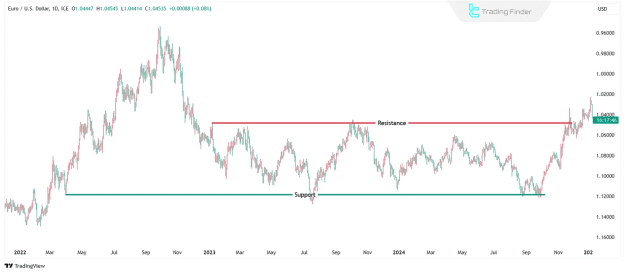
Critical Price Levels
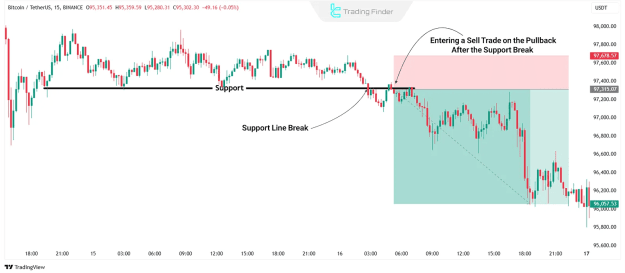
- Support Zones: Areas where buying interest overwhelms selling pressure
- Resistance Barriers: Regions where supply exceeds demand
- Breakout Confirmation: Sustained price movement beyond key levels with volume support
Analytical Toolset for Market Evaluation
Technical Indicators
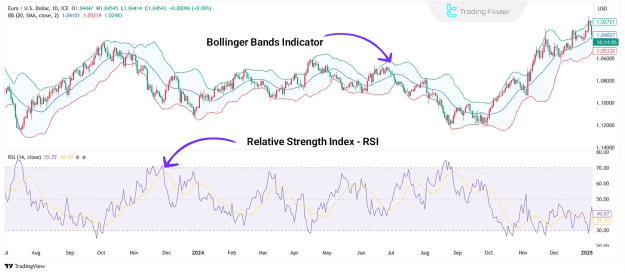
- Momentum Gauges: RSI, Stochastic Oscillator
- Trend-Following Tools: MACD, ADX
- Volatility Measures: Bollinger Bands, ATR
- Volume Analytics: OBV, VWAP
Moving Average Applications
- Simple Moving Averages: Best for identifying long-term trends
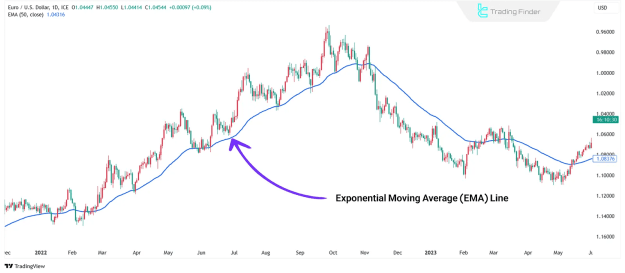
- Exponential Moving Averages: More responsive to recent price action
- Moving Average Crossovers: Generate potential entry/exit signals
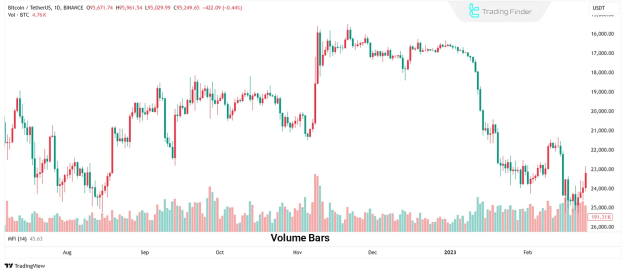
Volume Analysis
- Validates breakout authenticity
- Signals potential trend exhaustion
- Identifies institutional participation levels
Comparative Analysis of Market Approaches
Technical vs Fundamental Analysis
While technical analysis focuses purely on price data and chart patterns, fundamental analysis examines economic factors, financial statements, and macroeconomic conditions. Technical methods prove more effective for short-term trading, whereas fundamental analysis better serves long-term investment strategies.
Traditional Technical vs Price Action Trading
Price action trading eliminates technical indicators in favor of pure price behavior observation. This approach offers faster signal generation but requires deeper market intuition. Traditional technical analysis provides more structured frameworks suitable for systematic traders.
Classical vs Institutional Approaches
Modern institutional methodologies (ICT/Smart Money Concepts) emphasize liquidity analysis and order flow dynamics rather than conventional pattern recognition. These approaches attempt to decode large player behavior through market structure analysis.
Effective Trading Strategies
Pattern-Based Approaches
- Breakout Trading: Capitalizing on price movements beyond established ranges
- Reversal Trading: Identifying potential trend exhaustion points
- Range Trading: Exploiting cyclical price movements between support/resistance
Risk Management Protocols
- Position sizing based on account risk parameters
- Stop-loss placement beyond key technical levels
- Reward/risk ratio maintenance (minimum 1:2)
- Volatility-adjusted position management
Strategic Implementation Guidelines
- Market Condition Assessment: Determine trending or ranging environment
- Timeframe Alignment: Establish primary and confirmation timeframes
- Pattern Identification: Locate high-probability trade setups
- Confirmation Signals: Wait for supporting technical evidence
- Execution Planning: Define entry, stop, and profit targets
- Trade Management: Adjust stops and monitor price action
Conclusion
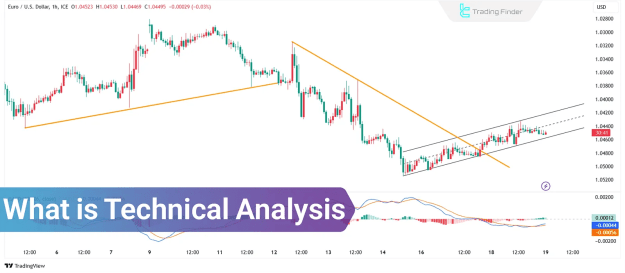
Mastering Market Analysis
Technical analysis remains an indispensable tool for market participants, offering structured approaches to price behavior interpretation. When combined with disciplined risk management and continuous education, it provides traders with significant analytical edge. The most successful practitioners develop hybrid approaches that incorporate elements from various methodologies while maintaining strict trading discipline.