TP & SL Tool: Risk Reward Ratio Calculator RRR MT4 | Prop Firm Protector: Trade Assist Prop Firm Plus TF Expert MT4 | Money Management + DrawDown Protector: Trade Panel Prop Firm Drawdawn Limiter Pro MT4 |Get a free Expert Advisor license via Telegram and WhatsApp
What Is Daily Bias?
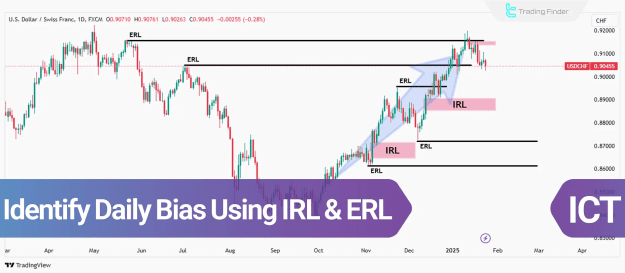
Daily Bias refers to the expected directional movement of price—either bullish, bearish, or consolidative—during a trading day.
This directional expectation is formed through a top-down analysis, starting from higher timeframes such as the weekly and daily charts, and narrowing down to intraday charts. Using IRL and ERL principles allows traders to interpret the intention behind market moves more accurately.
Importance of Daily Bias in Trading
Recognizing Daily Bias with a liquidity-based perspective enables traders to:
- Anticipate directional bias in advance
- Identify high-probability trade setups
- Align with institutional order flow
- Improve decision-making on intraday entries
How to Identify Daily Bias with IRL and ERL
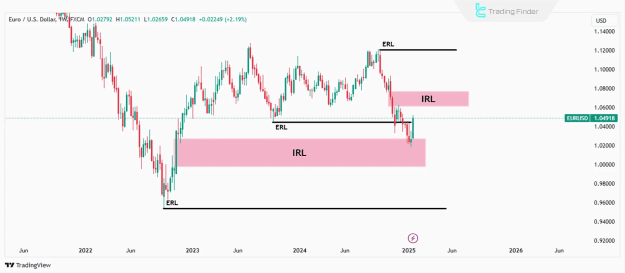
Step 1: Analyze Higher Timeframes
Begin with the weekly and daily charts to establish the broader market context.
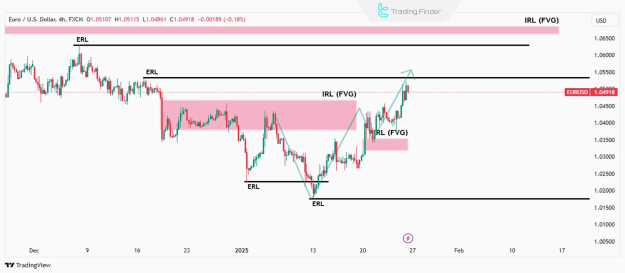
- External Range Liquidity (ERL): Mark previous highs and lows, which represent key liquidity zones where stop orders are commonly placed.
- Internal Range Liquidity (IRL): Identify Fair Value Gaps (FVGs) and imbalances that suggest areas where price is likely to react or retrace.
These zones serve as magnets for price and provide a roadmap for directional bias.
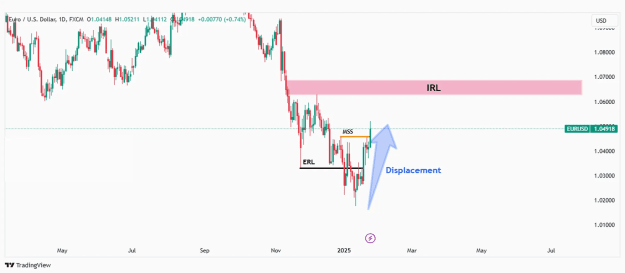
Step 2: Determine the Dominant Market Trend
After marking key liquidity levels, evaluate the overall market structure:
- Is the trend bullish, bearish, or ranging?
- Observe displacement moves and Market Structure Shifts (MSS) to confirm the direction of institutional order flow.
- Liquidity grabs beyond external ranges followed by a strong reversal may signal a change in directional bias.
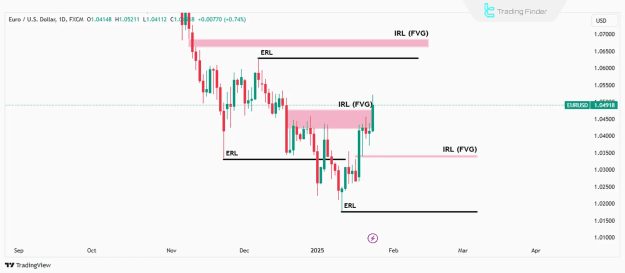
Step 3: Identify Key Liquidity Zones
Identify where liquidity resides:
- ERL: Previous session’s highs and lows or significant swing points
- IRL: Fair Value Gaps (FVGs), imbalances, and partially filled inefficiencies
These levels indicate likely future targets for price movement.
Step 4: Review Recent Price Action
Examine the most recent daily candles and market behavior:
- Has price recently collected external liquidity? If so, it may seek internal liquidity next.
- Analyze reactions around key levels to anticipate the next leg of price movement.
This phase confirms whether the bias identified on higher timeframes aligns with current price behavior.
Confirming Daily Bias on Lower Timeframes
After establishing the bias, move to intraday charts (1H, 4H):
- Look for Market Structure Shifts (MSS) or displacement moves in the direction of the higher timeframe bias.
- Use lower timeframe confirmations for precise entry and exit opportunities.
Key Points in Liquidity-Based Daily Bias Identification
- Internal Liquidity (IRL) is commonly found in Fair Value Gaps (FVGs) and imbalance zones.
- External Liquidity (ERL) is represented by old highs and lows, often targeted for stop hunts.
- Daily bias must be aligned with recent price action and refined using intraday structures.
- Top-down analysis is essential to avoid misjudging short-term volatility as meaningful trend.
Conclusion
The concept of Daily Bias, when anchored in the framework of Internal and External Liquidity, provides traders with a structured approach to understanding market direction. By beginning with weekly and daily charts and transitioning into lower timeframes for confirmation, traders can enhance the precision of their entries while remaining aligned with broader liquidity objectives.
Failing to incorporate this multi-timeframe analysis risks reacting to noise rather than following institutional intent.