TP & SL Tool: Risk Reward Ratio Calculator RRR MT5 | Prop Firm Protector: Trade Assist Prop Firm Plus TF Expert MT5 | Money Management + DrawDown Protector: Trade Panel Prop Firm Drawdawn Limiter Pro MT5 |Get a free Expert Advisor license via Telegram and WhatsApp
What Is the Interbank Price Delivery Algorithm (IPDA)?
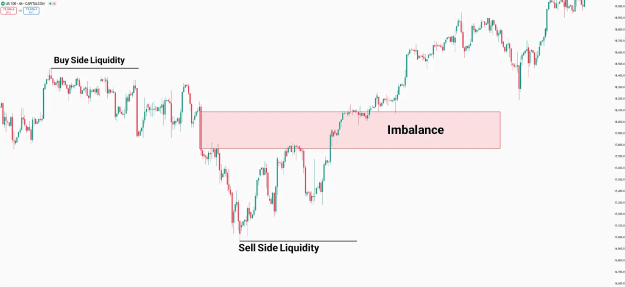
According to the ICT trading model, price movements are driven by liquidity—specifically the presence of liquidity pools and imbalance zones. The IPDA governs how institutional participants, often referred to as Smart Money, manipulate price based on a set of algorithmic rules rather than random fluctuations.
- Price is not determined randomly; it follows structured market-making principles.
- The algorithm focuses on identifying key liquidity accumulation levels and imbalance zones.
- Once liquidity is collected, the price adjusts imbalance and then targets the opposite liquidity pool.
IPDA Timeframe Structure
The IPDA framework uses a three-tiered time structure that reflects market behavior over different 20-day intervals:
- 20-day range
- 40-day range
- 60-day range
Each of these ranges represents a liquidity cycle where highs and lows serve as targets for institutional price delivery.
Key Characteristics
- The IPDA cycle is based on three 20-day lookback periods.
- These periods help identify critical liquidity points in the market.
- Price is often observed reaching for previous highs/lows, forming liquidity zones where smart money executes entries or exits.
How Does IPDA Work?
The IPDA methodology follows a systematic approach to identifying and targeting liquidity zones. The operation of this algorithm can be summarized as follows:
Identifying Key Liquidity Levels
- The algorithm begins at the start of the month.
- It looks back at the most recent 20-day range, followed by the 40-day, and finally the 60-day range.
- Each range’s highs and lows become significant liquidity accumulation areas.
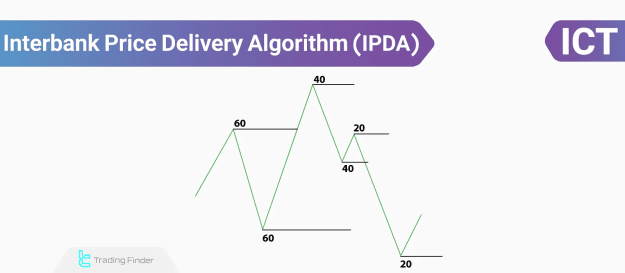
Price Movement Based on Liquidity and Imbalance
- After targeting liquidity above a 60-day high, price moves toward the 40-day low to collect liquidity.
- An imbalance zone is then addressed (balanced).
- Price continues toward the 60-day low, where another liquidity pool is reached.
- Following this collection, the market direction often reverses and targets the opposite liquidity level.
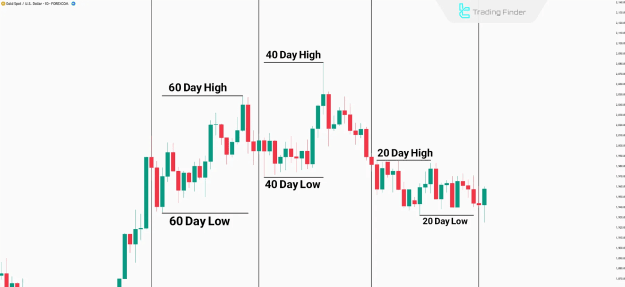
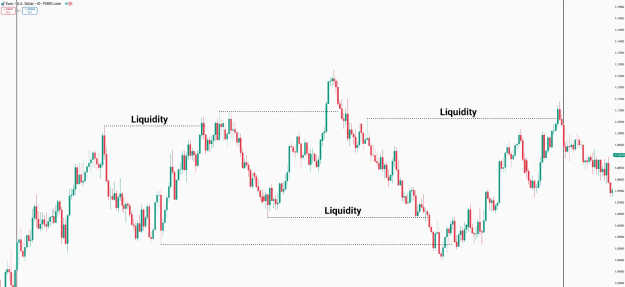
Visualizing IPDA in Market Charts
The Interbank Price Delivery Algorithm can be applied and observed on charts such as the EURUSD currency pair, where historical highs and lows over 20, 40, and 60-day periods clearly define liquidity zones.
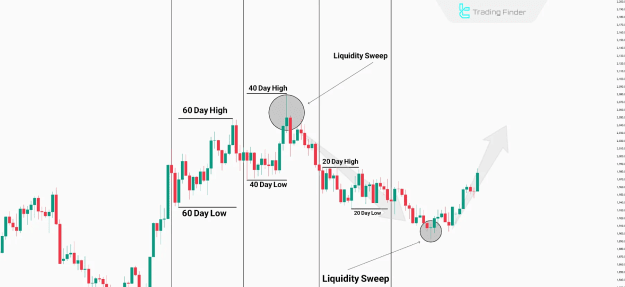
- These levels can be marked visually to track institutional price delivery in action.
- Observing how price reacts at these zones offers insight into market maker activity and potential trade opportunities.
Seasonal Shifts in IPDA
Another advanced feature of the IPDA model is the concept of seasonal or quarterly shifts, which reflect changes in price delivery behavior over longer timeframes.
Understanding IPDA Seasonal Shifts
- These shifts occur approximately every 3 to 4 months.
- They often represent significant changes in market direction or momentum.
- Seasonal shifts are best identified on higher timeframes, such as the daily or weekly chart.
By incorporating these seasonal dynamics, traders can better align with the macro liquidity delivery cycle, enhancing timing and trade precision.
Conclusion
The Interbank Price Delivery Algorithm (IPDA) is a core element in the ICT trading methodology, offering a structured way to understand and anticipate price movements based on liquidity collection and imbalance adjustment.
- IPDA relies on specific time intervals (20, 40, and 60 days) to determine key liquidity levels.
- Institutional participants follow this algorithm to manipulate price towards areas of liquidity interest.
- Understanding this concept empowers traders to identify high-probability setups by aligning with smart money intentions.
This liquidity-driven approach reveals that price is deliberately delivered, not randomly fluctuated, and offers a powerful edge in market analysis and strategy development.