TP & SL Tool: Risk Reward Ratio Calculator RRR MT4 | Prop Firm Protector: Trade Assist Prop Firm Plus TF Expert MT4 | Money Management + DrawDown Protector: Trade Panel Prop Firm Drawdawn Limiter Pro MT4 |Get a free Expert Advisor license via Telegram and WhatsApp
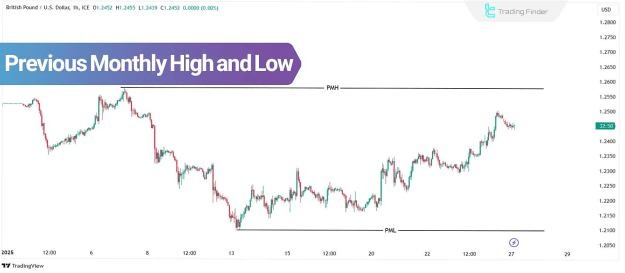
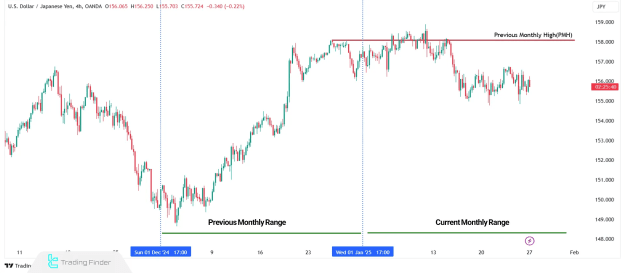
Previous Monthly High (PMH)
The PMH is the highest price point an asset achieved within a full trading month. On a candlestick chart, this level is typically marked by the upper wick of the highest candle.
Key Characteristics of PMH:
- Acts as a potential resistance level in future price movements
- Indicates bullish momentum if consistently broken upward
- Used in strategies like ICT (Inner Circle Trader) concepts to identify liquidity zones
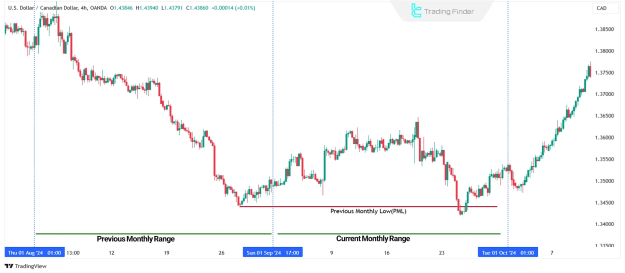
Previous Monthly Low (PML)
The PML is the lowest price point an asset touched within the previous month. On a candlestick chart, it is identified by the lower wick of the lowest candle.
Key Characteristics of PML:
- Serves as a potential support level in subsequent trading periods
- Signals bearish pressure if repeatedly broken downward
- Helps traders spot liquidity pools where stop-loss orders may cluster
Why Are PMH and PML Important in Trading?
These monthly extremes play a vital role in market analysis and trading strategies. Here’s why they matter:
1. Measuring Price Volatility
The difference between PMH and PML reflects the asset’s price range and volatility. A wider gap suggests higher fluctuations, while a narrow range indicates consolidation.
2. Support and Resistance Zones
- PMH often acts as resistance—price may struggle to break above it.
- PML frequently serves as support—price may bounce upward from this level.
3. Liquidity and Stop-Loss Hunting (ICT Concepts)
Institutional traders monitor these levels to identify liquidity zones, where retail traders' stop-loss orders are likely clustered. Breakouts or reversals near PMH/PML can trigger significant price movements.
4. Trend Identification
- Uptrend Confirmation: Consistently higher PMH and PML suggest a bullish trend.
- Downtrend Confirmation: Lower PMH and PML indicate bearish momentum.
5. Higher Timeframe Analysis
Monthly levels help determine long-term trends and seasonal price behavior, making them essential for swing traders and investors.
How to Use PMH and PML in Trading Strategies
Breakout Trading
- A close above PMH may signal a bullish breakout.
- A close below PML could indicate a bearish breakdown.
Mean Reversion Strategies
- Traders may fade (counter-trade) moves toward PMH/PML, expecting reversals near these levels.
ICT Liquidity-Based Entries
- Look for false breakouts above PMH or below PML to trap liquidity before a reversal.
Conclusion
Previous Monthly High (PMH) and Previous Monthly Low (PML) are foundational concepts in technical analysis, offering insights into market structure, trend direction, and key trading levels. Whether used for support/resistance analysis, liquidity hunting, or trend confirmation, these monthly extremes provide traders with actionable data to refine their strategies.