FVG and Void indicator
FVG and Void indicator MT4:
https://tradingfinder.com/products/i...free-download/
FVG and Void indicator MT5:
https://tradingfinder.com/products/i...free-download/
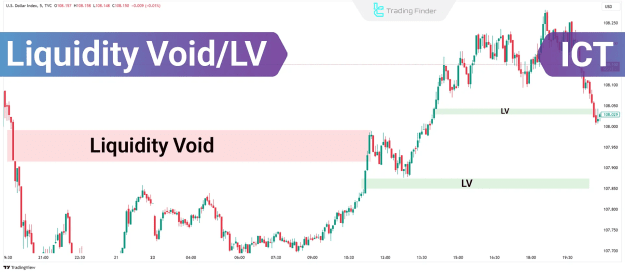
What Is an ICT Liquidity Void?
In financial markets:
- Liquidity represents the ease with which assets can be bought or sold without affecting price.
- A void suggests a vacuum—an absence of trading activity or order flow.
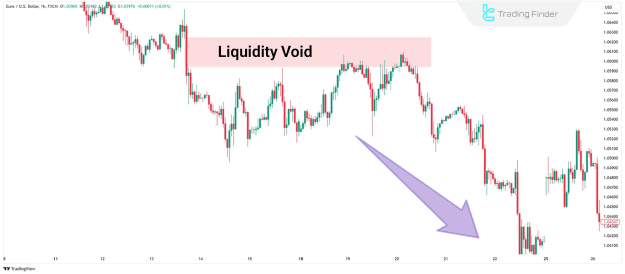
An ICT liquidity void forms when price violently breaks away from a consolidation range without returning to previous price levels. This fast, one-sided movement reveals an imbalance in supply and demand, leaving behind untraded price zones.
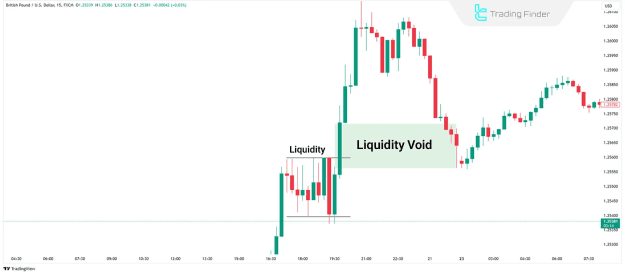
Bullish Liquidity Void Explained
A bullish liquidity void emerges when price exits a period of sideways movement and accelerates upward with large candles, bypassing prior levels.
Key Characteristics:
- Strong bullish breakout from a tight range
- Minimal or no lower wicks in breakout candles
- Absorption of sell-side liquidity (stop-losses and pending orders)
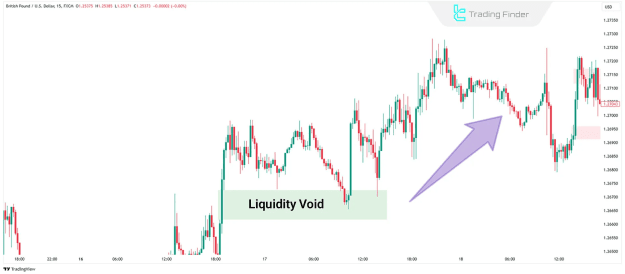
Trading the Bullish Liquidity Void
To approach this structure with precision:
- Trend Assessment: Confirm the market is in an overall bullish context.
- Wait for Retracement: Price often revisits the void to mitigate inefficiencies.
- Look for Long Entries: Buy setups commonly emerge within or near the lower boundary of the void.
- Support Zone: The void often serves as a key dynamic support level.
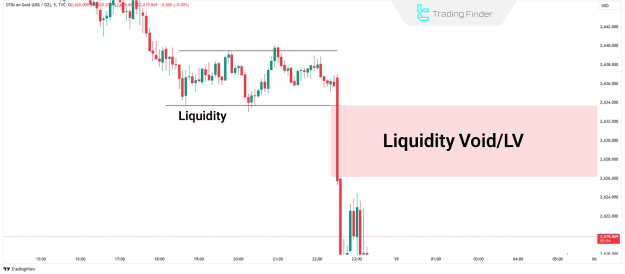
Bearish Liquidity Void Explained
A bearish liquidity void is the inverse, appearing when price breaks downward with strength from a consolidation zone, ignoring previous price structures.
Defining Features:
- Large bearish candles with little or no upper wicks
- Aggressive sell-off without pause
- Rapid consumption of buy-side liquidity
Trading the Bearish Liquidity Void
For traders targeting shorts:
- Establish Bearish Context: Confirm bearish momentum and structure.
- Anticipate Pullbacks: Price frequently returns to the void before resuming the decline.
- Short from Resistance: The upper edge of the void becomes a powerful resistance area.
- Entry Zone: Monitor lower timeframes for confirmation inside the void.
Do Liquidity Voids Always Get Revisited?
- There is no guarantee that price will revisit or fill the void.
- In some cases, the void may be filled shortly after formation; in others, it may remain untouched for days or even weeks.
- Market dynamics, volatility, and institutional order flow all influence whether a void is addressed.
ICT Liquidity Void vs. Fair Value Gap (FVG)
Although both highlight inefficiencies in price movement, there are critical differences:
Liquidity Void (LV):
- Represents a broader zone of imbalance
- Formed by multiple large candles moving in one direction
- Indicates absence of counter-orders across a range
Fair Value Gap (FVG):
- A smaller, specific price gap between three candles
- Typically identified between the high and low of adjacent candles
- Used for short-term entries or target zones
Final Thoughts
Liquidity voids are essential markers of institutional activity and price imbalance. They signal moments when one side of the market—buyers or sellers—is absent, allowing for aggressive movement in the other direction. While these zones often provide high-probability trading opportunities, they do not guarantee price will return. A solid understanding of market structure, trend conditions, and proper risk management is crucial when using liquidity voids as part of your trading strategy.