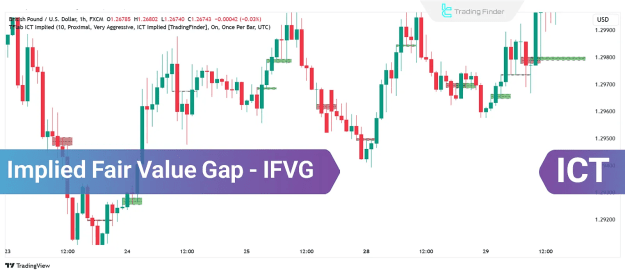
Implied Fair Value Gap Indicators:
Implied Fair Value Gap Indicator MT4
Implied Fair Value Gap Indicator MT5
Structure of the Implied Fair Value Gap (IFVG)
The IFVG is defined by a specific three-candlestick formation:
- A central candlestick with a large real body, indicating a strong price movement.
- Two adjacent candlesticks (preceding and succeeding), where the wicks partially or fully overlap the body of the middle candle.
This overlapping structure forms a hidden imbalance—hence the term implied. While no visible gap appears on the chart, it still serves as an effective supply or demand zone, depending on the market context.
Types of IFVG Structures
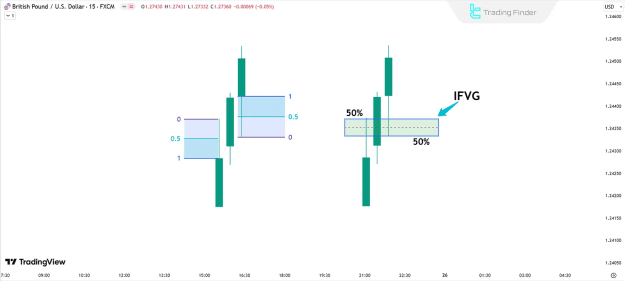
Bullish IFVG
- The middle candle is bullish and large-bodied.
- The wicks of the candles on either side dip into the body of this central bullish candle.
- This structure suggests underlying bullish pressure and can be used to anticipate potential upward price movements.
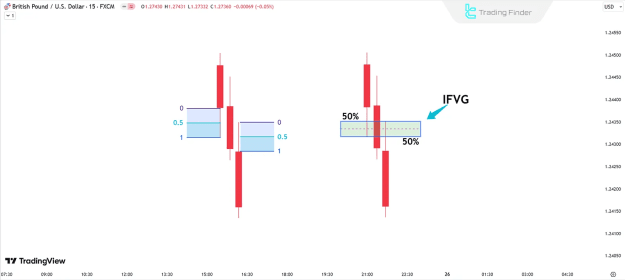
Bearish IFVG
- The central candle is large-bodied and bearish.
- The neighboring candles’ wicks encroach into this central body.
- Often indicates a latent bearish imbalance likely to result in downward price correction.
How to Identify the Implied Fair Value Gap (IFVG)
Identifying an IFVG requires a systematic four-step process:
Step 1: Observe Price Movements
- Scan for sharp market moves characterized by large-bodied candles.
- These candles often reflect institutional order flow and significant liquidity shifts.
Step 2: Analyze Adjacent Candles
- Examine the candlestick that precedes and follows the large-bodied candle.
- If their wicks penetrate into the range of the central candle’s body, this suggests a hidden price imbalance—indicating the formation of an Implied Fair Value Gap.
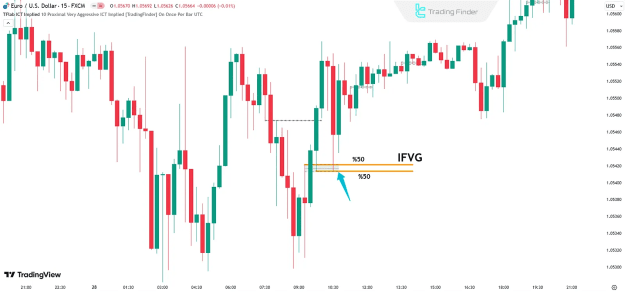
Step 3: Apply Fibonacci Tool
To mark the IFVG with greater precision, apply the Fibonacci retracement tool as follows:
- Bullish IFVG:
- Measure 50% of the upper wick of the first (preceding) candle.
- Measure 50% of the lower wick of the third (succeeding) candle.
- Bearish IFVG:
- Measure 50% of the lower wick of the first candle.
- Measure 50% of the upper wick of the third candle.
Step 4: Define the IFVG Zone
- The gap between the two calculated Fibonacci levels represents the IFVG zone.
- This area is considered a high-probability price reaction zone, where traders can anticipate reversals or pullbacks.
Importance of IFVG in Technical Trading
The IFVG is a powerful concept within ICT-style trading strategies, offering several practical benefits:
- Reveals hidden price inefficiencies undetectable to most retail traders.
- Improves trade timing, offering refined entry and exit signals.
- Enhances confluence when combined with other ICT concepts such as Order Blocks, Liquidity Pools, and Market Structure.
- Provides a low-risk, high-reward trading zone when aligned with higher time frame bias.
Real-World Examples of IFVG
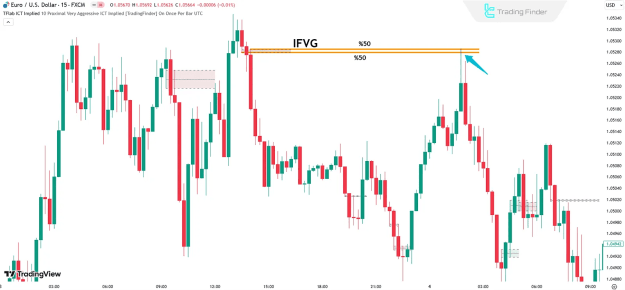
Bearish IFVG in Action
In live markets, Bearish IFVGs often result in price retracing to the IFVG zone before continuing downward. This offers a precise short entry opportunity.
Bullish IFVG Example
A Bullish IFVG can act as a strong demand zone, where price reacts sharply after re-entering the calculated IFVG range. This is a prime area for buy setups in alignment with a bullish trend.
Conclusion
The Implied Fair Value Gap (IFVG) is a refined concept within the ICT methodology, identifying hidden zones of price imbalance without the presence of an overt gap. By recognizing the overlapping wick structures and applying Fibonacci analysis, traders can uncover powerful supply and demand areas that offer high-probability trade setups. Incorporating IFVGs into your trading framework provides greater precision, strategic edge, and market clarity, especially when used alongside institutional concepts such as Order Blocks and Liquidity Engineering.