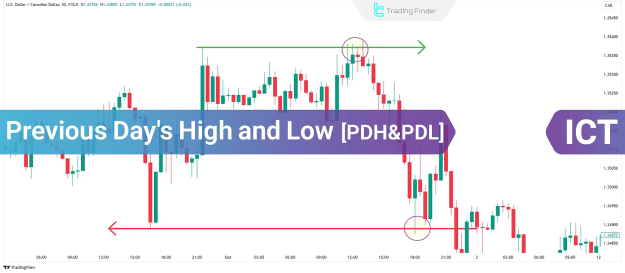
What Are PDH and PDL?
The Previous Day’s High (PDH) and Previous Day’s Low (PDL) are critical price levels used in trading strategies, particularly in ICT (Inner Circle Trader) methodologies. These levels represent the highest and lowest prices from the prior trading session, serving as key reference points for identifying potential support and resistance zones.
- PDH = Highest price of the previous trading day.
- PDL = Lowest price of the previous trading day.
By analyzing these levels, traders gain insights into market behavior, allowing them to anticipate possible price reactions in the current session.
How to Identify PDH and PDL on a Chart
Before the market opens, traders should mark the PDH and PDL on their charts. These levels can be manually drawn using horizontal lines, providing clear visual cues for potential entry and exit points.
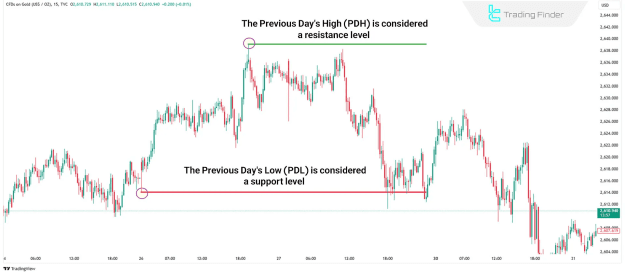
Example of PDH and PDL on a Price Chart
- PDH acts as a resistance zone where price may reverse downward.
- PDL serves as a support zone where price may bounce upward.
Market Strength and Sentiment Through PDH & PDL
The interaction between price and these levels reveals market sentiment:
- Strong Bullish Momentum: If price remains above PDH in early trading, it indicates strong buying pressure.
- Weak Market Conditions: If price stays above PDL but fails to break PDH, it suggests indecision or bearish weakness.
- Bearish Rejection: If price struggles to hold above PDL, it signals potential downward continuation.
Trading Strategies Using PDH and PDL
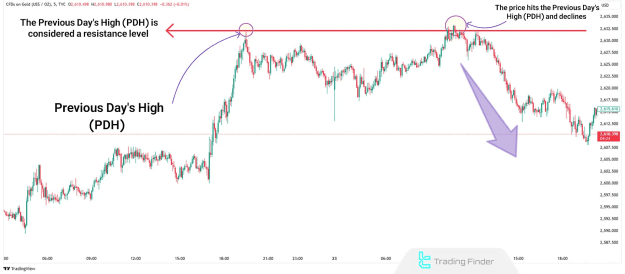
1. Selling at PDH (Resistance Zone)
- When price approaches PDH, traders watch for bearish reversal patterns (e.g., rejection candles, divergence).
- A confirmed rejection at PDH presents a potential short-selling opportunity.
Example: On a 5-minute Gold chart, if price tests PDH and forms a bearish engulfing pattern, traders may consider entering a sell trade.
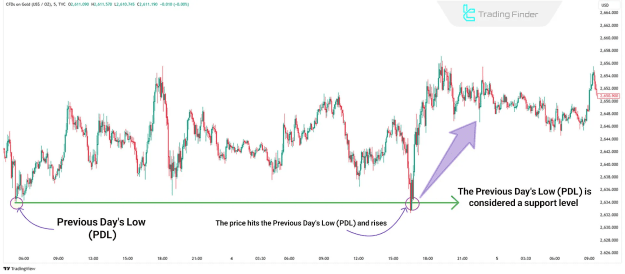
2. Buying at PDL (Support Zone)
- When price declines to PDL, traders look for bullish reversal signals (e.g., hammer candles, bullish divergence).
- A bounce from PDL offers a potential long entry.
Example: On a 5-minute chart, if price touches PDL and forms a bullish pin bar, traders may look for a buy opportunity.
Conclusion
The Previous Day’s High (PDH) and Previous Day’s Low (PDL) are essential tools for intraday traders. These levels help gauge market sentiment, identify key support and resistance zones, and improve trade execution. By incorporating PDH and PDL into their analysis, traders can enhance their decision-making process and capitalize on high-probability setups.
Key Takeaways:
![]() PDH & PDL act as dynamic support/resistance levels.
PDH & PDL act as dynamic support/resistance levels.
![]() Price reactions at these levels indicate market strength or weakness.
Price reactions at these levels indicate market strength or weakness.
![]() Traders can use PDH for sell setups and PDL for buy setups.
Traders can use PDH for sell setups and PDL for buy setups.
![]() Always confirm reversals with additional technical analysis.
Always confirm reversals with additional technical analysis.
By mastering these concepts, traders can refine their strategies and improve their trading performance.