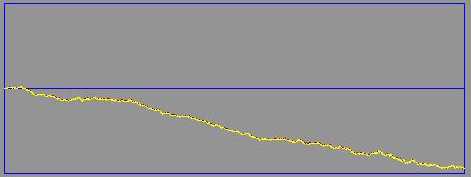
I attached two images that show how the profit and loss curve looks like. (I do not know if they will appear as images, or only as attachments).
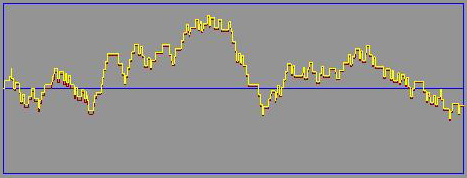
The first one is the one year curve, the second one is a magnified section of the past two weeks.
You can see that there are sharply rizing periods, so backtesting only short period (days or weeks) can be very misleading.
The first one is the one year curve, the second one is a magnified section of the past two weeks.
You can see that there are sharply rizing periods, so backtesting only short period (days or weeks) can be very misleading.
Attached Images