Key Components of the MACD Indicator
The MACD indicator consists of three integral parts:
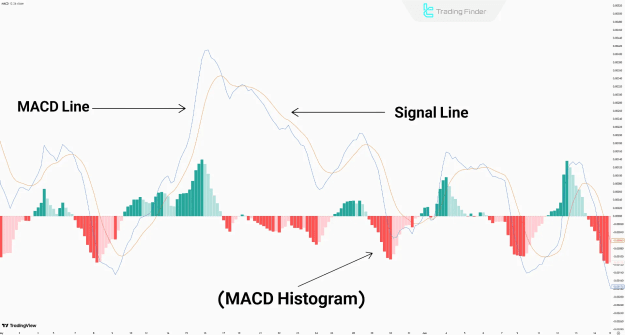
MACD Line
- Calculated by subtracting the 26-period Exponential Moving Average (EMA) from the 12-period EMA.
- A position above the zero line indicates dominant buying momentum, while a position below signifies selling momentum.
Signal Line
- A 9-period EMA of the MACD Line used to filter market noise.
- A crossover from below suggests growing bullish momentum; a crossover from above reflects increasing bearish sentiment.
MACD Histogram
- Illustrates the difference between the MACD Line and the Signal Line.
- Positive bars suggest bullish control, while negative bars highlight bearish dominance.
- The size of the bars signifies the strength of the ongoing trend.
Top 5 MACD Trading Strategies
MACD's design allows for the implementation of diverse strategies that accommodate multiple market environments. The following are five prominent trading techniques utilizing the MACD indicator:
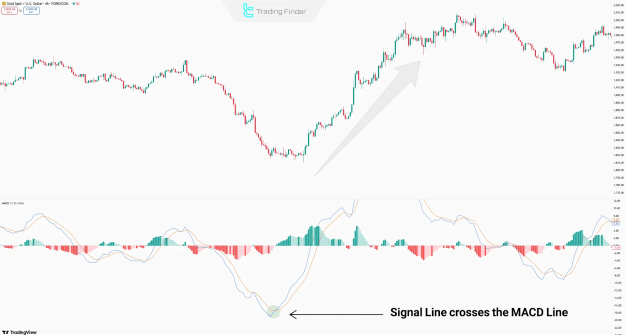
1. The Crossover Strategy
This approach focuses on crossovers between the MACD Line and the Signal Line to identify trend shifts.
- Buy Signal: Signal Line crosses above the MACD Line.
- Sell Signal: Signal Line crosses below the MACD Line.
Tip: Enhance accuracy by combining this strategy with support/resistance analysis or other indicators.
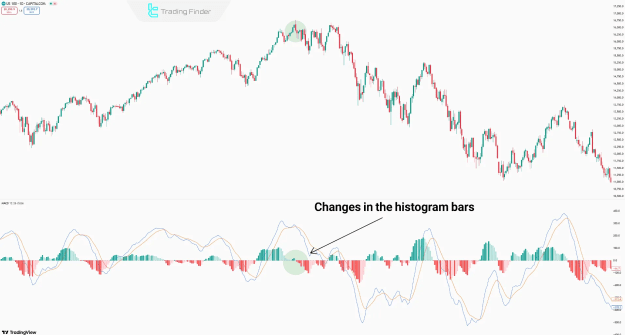
2. The Histogram Reversal Strategy
Changes in histogram bar direction and length on higher timeframes (such as 4H or Daily) can reveal emerging momentum shifts.
- Sell Signal: Transition from positive to negative bars.
- Buy Signal: Change from negative to positive bars.
Tip: Signal reliability increases near key support/resistance zones and with more extended histogram bars.
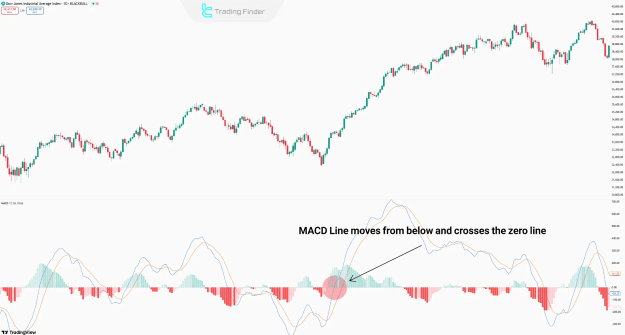
3. The Zero Line Crossover Strategy
The zero line acts as a critical balance point in the MACD, marking shifts in market direction.
- Bullish Reversal: MACD Line crosses above the zero line.
- Bearish Reversal: MACD Line crosses below the zero line.
Tip: Optimal results occur on higher timeframes and when used in conjunction with price action or trendline breaks.
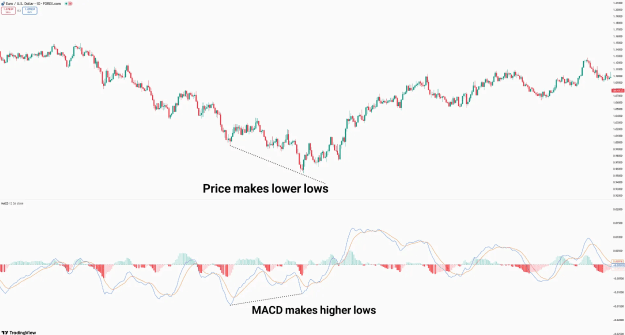
4. The Divergence Strategy
Divergences between price and MACD suggest potential reversals or corrections.
- Bullish Divergence: Price forms lower lows, while MACD creates higher lows.
- Bearish Divergence: Price forms higher highs, while MACD forms lower highs.
Tip: Confirm with classic chart patterns (e.g., double bottoms/tops) to filter false signals.
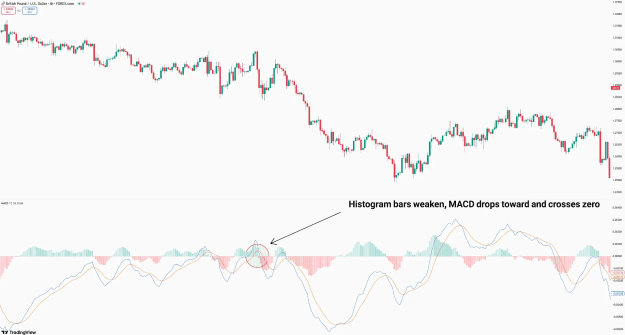
5. MACD Momentum Waves Strategy
This method leverages histogram bar size and MACD movement relative to the zero line to detect momentum transitions.
- Buy Setup:
- MACD and histogram below zero.
- Histogram bars begin to shrink.
- MACD line turns upward toward and crosses the zero line.
- Sell Setup:
- MACD and histogram above zero.
- Bars decrease in size.
- MACD line turns downward and crosses the zero line.
Advantages and Disadvantages of the MACD Indicator
Understanding both the benefits and limitations of the MACD indicator helps determine when it can be applied most effectively:
Pros
- Combines trend-following and momentum-based analysis.
- Suitable for multiple timeframes.
- Detects potential trend reversals via zero-line crosses.
- Highlights momentum exhaustion through divergence.
- Easily integrated with other technical indicators.
Cons
- May produce false signals in sideways markets.
- Signal lag due to reliance on moving averages.
- Line crossovers do not always generate decisive trade setups.
- Histogram may behave unpredictably in volatile conditions.
- Requires additional filters in high-volatility environments.
Optimal MACD Settings for Different Trading Styles
The MACD’s default settings can be customized depending on trading objectives and market conditions:
Scalping
- Timeframe: 1 to 15 minutes
- MACD Line: (5,13,16)
- Signal Line: EMA (5)
- Characteristics: High sensitivity, rapid signal response
Day Trading
- Timeframe: 15 minutes to 1 hour
- MACD Line: (5,21,8)
- Signal Line: EMA (5)
- Characteristics: Balanced speed, reduced noise
Swing Trading
- Timeframe: 4H to Daily
- MACD Line: (9,26,12)
- Signal Line: EMA (9)
- Characteristics: Standard settings, general-purpose
Position Trading
- Timeframe: Daily to Weekly
- MACD Line: (18,52,24)
- Signal Line: EMA (18)
- Characteristics: Focus on long-term trend shifts
Final Thoughts
The MACD indicator serves as a comprehensive tool for analyzing market momentum and identifying trend reversals. By leveraging its three core components—the MACD Line, Signal Line, and Histogram—traders can monitor both trend direction and strength.
Each MACD strategy, including the Crossover, Histogram Reversal, and Divergence Method, provides distinct perspectives for trade execution and market timing. When combined with other technical tools and used on suitable timeframes, the MACD becomes a powerful element of any trading system.