What Is ICT SMT Divergence?
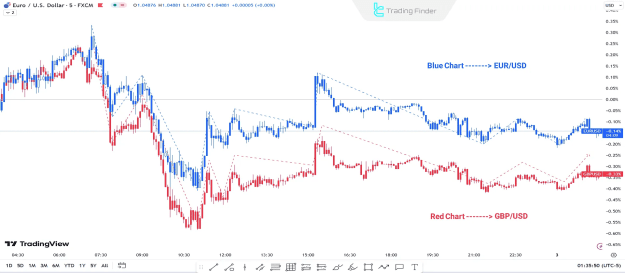
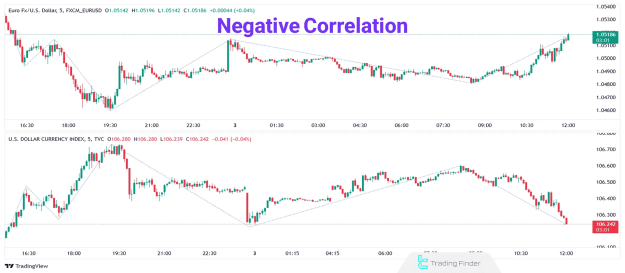
In normal market conditions, correlated assets tend to move symmetrically. For instance, in positively correlated pairs like EUR/USD and GBP/USD, if one asset forms a Higher High (HH), the other usually mirrors the same behavior.
SMT Divergence occurs when this expected symmetry breaks:
- One asset forms a Higher High (HH);
- The other fails and creates a Lower High (LH).
This divergence indicates potential market manipulation and serves as a reversal signal.
Example Scenarios:
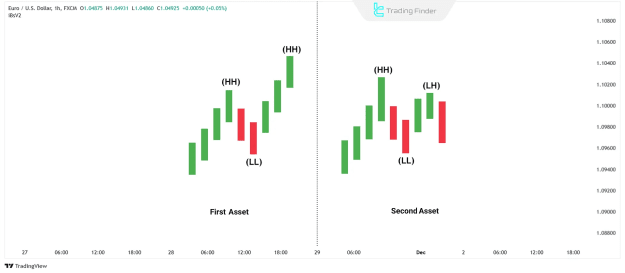
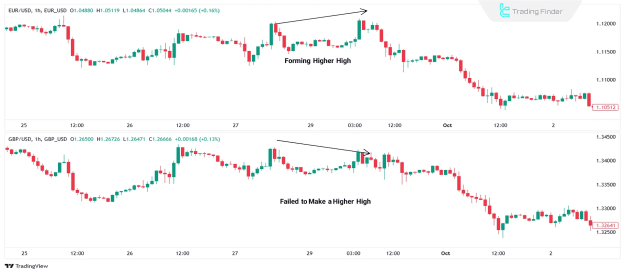
- Positive Correlation: EUR/USD creates a HH, while GBP/USD forms an LH.
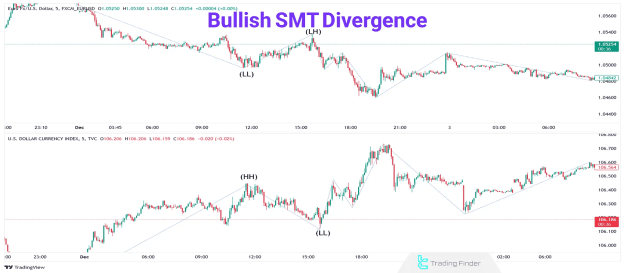
- Negative Correlation: EUR/USD forms a Higher Low (HL), while the US Dollar Index (USDX) creates a Lower High (LH).
Using ICT SMT Divergence in Trading
This strategy becomes highly effective when combined with concepts like the Premium/Discount Array (PD Array) and proper market structure analysis.
How to Apply ICT SMT Divergence:
- Compare two correlated assets on the same timeframe.
- Look for divergence in key swing points (HH, LH, HL, LL).
- Use this divergence as a confirmation signal in confluence with other ICT concepts.
Common Correlated Pairs:
- Forex: EUR/USD vs. GBP/USD (positive correlation)
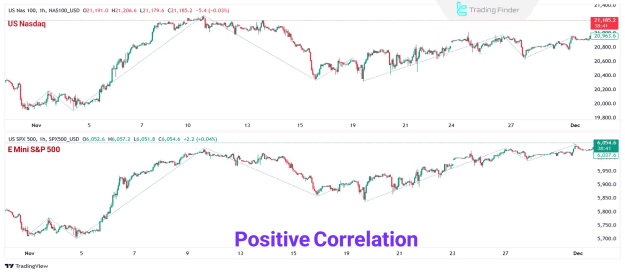
- Indices: Nasdaq 100 (NQ) vs. S&P 500 (ES)
- Crypto: Bitcoin (BTC) vs. Ethereum (ETH)
- Negative Correlation Examples: EUR/USD vs. DXY (US Dollar Index)
Types of ICT SMT Divergence
SMT Divergence is classified based on the market direction and asset correlation type:
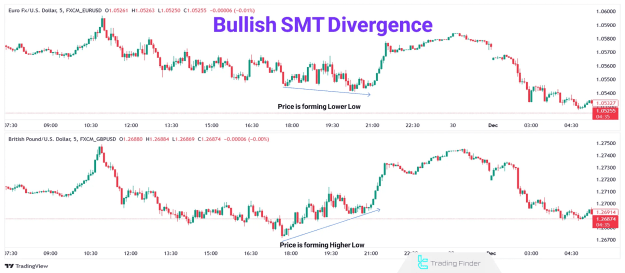
Bullish SMT Divergence
- In positively correlated assets: Both are in a downtrend, but one forms a Lower Low (LL) while the other forms a Higher Low (HL).
- In negatively correlated assets: One asset makes a Lower High (LH); the other forms a Lower Low (LL) instead of an HL.
Interpretation: The asset that creates the LL (or fails to create the HL) is likely manipulated, suggesting a bullish reversal.
Bearish SMT Divergence
- In positively correlated assets: Both are in an uptrend, but one forms a Higher High (HH) while the other makes a Lower High (LH).
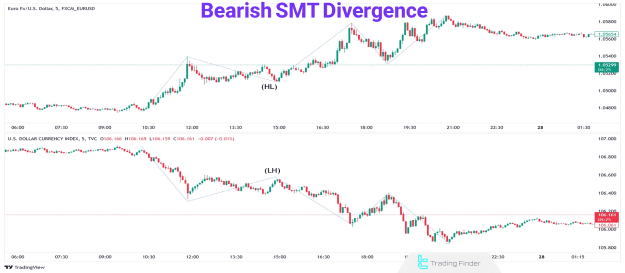
- In negatively correlated assets: One forms a Higher Low (HL); the other creates a Lower High (LH) instead of an HH.
Interpretation: The asset that fails to maintain the HH is considered manipulated, indicating a bearish reversal.
ICT SMT Divergence Indicator Tools
The TFLAB team has developed an SMT Divergence indicator specifically based on the ICT Smart Money framework. These tools help visually identify divergence patterns between correlated assets.
- MetaTrader 4 (MT4)
- MetaTrader 5 (MT5)
- TradingView
These indicators allow traders to easily recognize divergences and align trades with institutional order flow.
Best Timeframe for SMT Divergence Analysis
- Optimal timeframe: 15-minute or lower
- Why: Lower timeframes offer timely signals and reduce the risk of delayed entries.
- Caution: On higher timeframes, divergence patterns may appear late and reduce trade efficiency.
Conclusion
ICT SMT Divergence is a powerful analytical tool for identifying manipulated market conditions and potential reversal points. By comparing price action in two correlated assets, traders can detect smart money activities and improve the accuracy of their entries.
Initially introduced in indices like NQ and ES, the SMT concept has expanded to Forex, cryptocurrencies, and other asset classes. Its reliability increases significantly when used with strongly correlated instruments and within defined market structures.