HRLR & LRLR ICT Indicator:
HRLR & LRLR ICT Indicator MT4
HRLR & LRLR ICT Indicator MT5
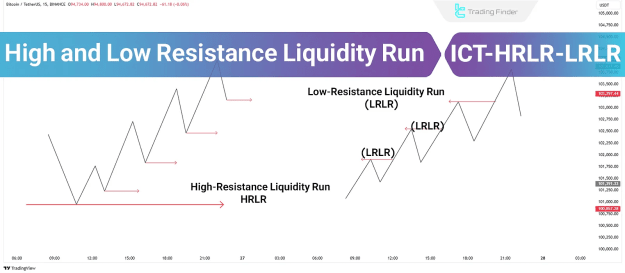
What Is a High-Resistance Liquidity Run (HRLR)?
A High-Resistance Liquidity Run (HRLR) occurs when price movement toward a previous high or low is hindered by multiple technical barriers, such as:
- Intermediate highs and lows
- Order Blocks (OBs)
- Premium/Discount arrays (PD Arrays)
These price actions usually unfold gradually and are frequently influenced by fundamental drivers like macroeconomic news.
Characteristics of High-Resistance Liquidity Run (HRLR)
- Gradual and delayed price progression
- High trading volume near significant resistance levels
- Often indicates potential trend reversal or momentum deceleration
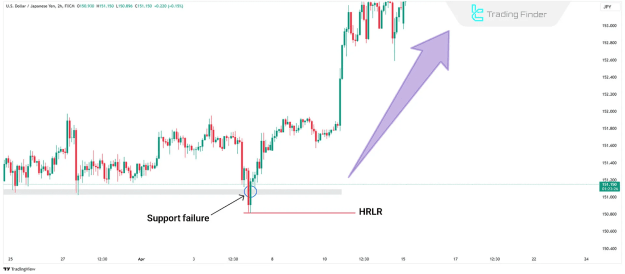
Bullish HRLR Example
A bullish HRLR can be observed in instruments such as USD/JPY on a 2-hour chart:
- Price moves toward a key support level.
- Upon breaking the level, Sell Stop orders are triggered.
- Price swiftly rebounds upward, indicating a Buy setup at the point of reversal.
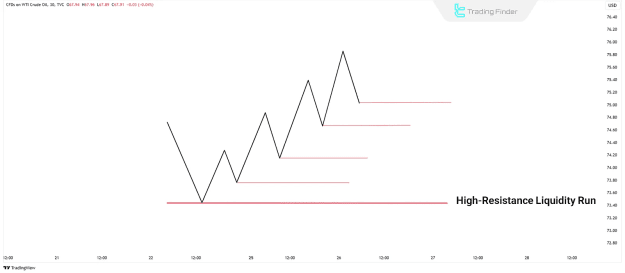
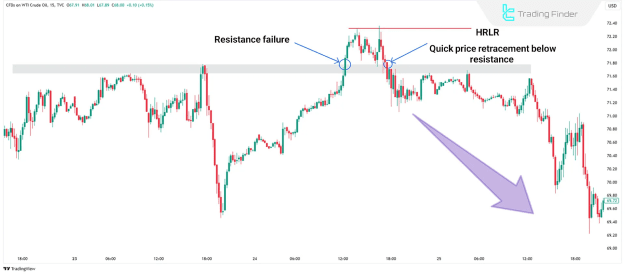
Bearish HRLR Example
A bearish HRLR scenario may occur in USOIL on a 15-minute chart:
- Price ascends toward a major resistance level.
- Buy Stop orders are activated once the level is breached.
- A sharp decline follows, presenting a favorable Sell opportunity.
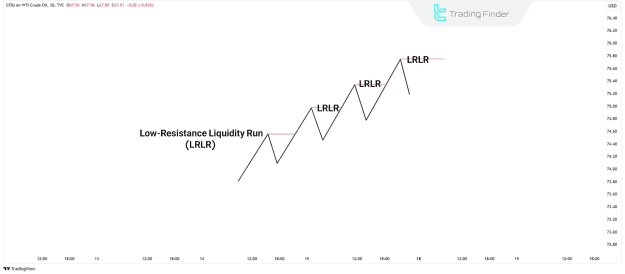
What Is a Low-Resistance Liquidity Run (LRLR)?
A Low-Resistance Liquidity Run (LRLR) describes a situation where the price advances through liquidity zones with minimal friction. These moves often give rise to Liquidity Voids or Fair Value Gaps (FVGs).
- In a downtrend, price effortlessly sweeps sell-side liquidity below minor lows.
- In an uptrend, price easily clears buy-side liquidity above short-term highs.
Characteristics of Low-Resistance Liquidity Run (LRLR)
- Swift and smooth price action through liquidity clusters
- Lower volume compared to HRLR setups
- Typically confirms the ongoing trend direction
Bullish LRLR Example
In bullish conditions, such as seen on a Bitcoin chart:
- Liquidity is identified near a strong support level.
- Price breaches this level, triggering sell-side orders.
- Reversal signs emerge, leading to a potential Buy entry after confirmation.
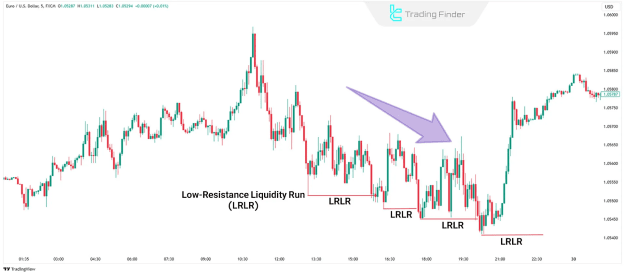
Bearish LRLR Example
A bearish LRLR can be observed on instruments like EUR/USD:
- A key support level is identified and breached.
- Buy orders are triggered above this zone.
- Price declines with momentum, confirming a Sell position after the reversal signal.
Key Differences Between HRLR and LRLR
Understanding the distinct characteristics of HRLR and LRLR is crucial for selecting appropriate trading strategies.
High-Resistance Liquidity Run (HRLR)
- Involves multiple resistance points during price travel
- Price movement is slow and deliberate
- Suitable for patient traders willing to wait for full setups
Low-Resistance Liquidity Run (LRLR)
- Path of least resistance with few obstacles
- Price moves quickly and efficiently through liquidity
- Ideal for traders looking for fast-moving opportunities
Conclusion
Both High-Resistance Liquidity Runs (HRLR) and Low-Resistance Liquidity Runs (LRLR) offer valuable insight into market structure and price behavior.
- LRLR setups are generally preferred for their clarity and speed, making them more suitable for frequent trading and easier execution.
- HRLR setups, on the other hand, require more time to mature and are often influenced by external events such as FOMC announcements or NFP releases.
Understanding and applying these concepts can significantly enhance a trader's ability to forecast price action, set realistic profit targets, and manage risk effectively.