current approach (12222011) --
perspective need:
confront/avoid,act/respond,follow (within bounds of each object: price-action's distance/directness
vs. forward, standard-distance plane of existence for object)
direct,hover over,entrain continue/extinct in / excludable within separate and bound
DRAWING DEVICE
dot-balanced shape: triangle/wedge; rectangle / wide s/r; ellipse/curve; temporary (1-, 2-sided)
line-balanced shape(incl. angle,length of micro-trends): cup and handle / fighter jet; Gartley (etc.); centered,opposed shapes area
-- enhance (, shape): midline,logr,curve
-- multiply (, shape): grid; l.p.4 (screen,proxy); Gann (separate,extend)
area: count(fibo,fractal,whole(1/4,1/2,1/3,etc.))/rhythmic; multi-angle/condensed; random/volatile;
SERIES stability (flow(serial) w/ objects, each with a speed of attention(parallel)
----------
resources
free, drawable charts online -- 1,2,3,4,
short online games related to chart study: 1,
psychological games a trader may need: 1,2
brainwave freeware 1,2,3,4,5
the 'fighter jet' and the (l.p.4: ) line proxy type of pattern I created -- see near bottom of journal, post 323.
Area, draw TL's from:
1. ellipse centerline on edge of
2. logr fan that is an
3. midline from or ninety-degree angle of
4. level opposition or hi-lo compromise to release or build pressure and turn from
5. aligned turn pivots, bunched runs inside, even waves, flat line or tiny balances
line patterns
This thread is a collection of older, developing ideas
of or addressed to a forex rookie.
index
From the beginning of this thread, somewhat unconsciously, I strived to get one system for all patterns. Pairs (EUR/USD,) are richest in chart patterns; one example is multiple-shape, heiken-ashi-candle patterns. I got to specific patterns (posts # 2-7,9), a developing context of purpose statements (8,16,27,35), an early several-pattern system (11, 18, 19). I also looked to automatic stuff along the way, to see what they had and to try and adapt it into something useable (drawing tools (posts 12,13,15,21,26(mostly) ) and indicators (posts 23,25,28,30-2,34,36,37,40,43) ). Finally, I had to take a break (6, 17,45-6), get discipline (33) and take others' advice ( after others' posts). My still-developing method begins at post 44 and charts news affect through my pattern recognition table ( ) and bar-spread trendlines.
(post 58+) This prt works with forex patterns superficially, in that it only considers balance patterns, which is forex's forte, with respect to roller language, which is (individual, especially smaller- (news-responsive)) stocks-appropriate. The product is only visually, not mathematically, measurable. Forex's balance patterns can stand on their own; thus, this prt is dropped and I'm in search of a standard way to present a new understanding of balance patterns.
in e/u, #1-45 (more pattern than line); in g/u,#46-on (more line than pattern), with bsTL's (#46-on)
__________________________________________________________________
ideas after 11222011:
ideas only in post #1 and older than 07232010:
description
candlesticks. Logarithm vs. midline nature of them. To go mostly only one way; or, express a deadlock between two of the same; or, a build one way and then a spasmodic letgo of that build due to crossed direction of pressure.
-------------LINE PATTERNS : four descriptions of types 1-5-------------
NAME (APPEARANCE)
1 internal (pivot/dot, level/line)
2 both/shape (blur)
3 repeated
4 rolling (differentiated / L:M-repeated)
5 castle (symmetric) opt. off rolling
CHARACTERISTIC (EXPRESSION OF PRESSURE)
1 a simple internal L:M relation
2 regular polygon (n=3-4, infinite: triangle, square, circle; to produce dot, line)
3 proxy line balancing the other TL's fro,at,to
4 dependent dot or line (set) the patterns related to it actively react with L:M-wise
5 parallel (hi,lo, mid true, mid natural, logr) lines
CONTINUITY (NO FALSE EXPRESSIONS OF OVERALL DIRECTION)
1 N with occasional partial Y help on pivot
2 somewhat random percent of Y
3 immediate N within pattern's area, then Y for a medium while after
4 Y within its set area and then during TLs' affect
5 Y, multiply divided (only split, with rolling) and thus, in a sense, forever
CONTROL (LENGTH OF HOLD PRESSURE HAS ON DIRECTION)
1 immediate
2 shape-dependent
3 moderate
4 proportional (while others do)
5 reframes continuously (anchors for longterm, off rolling)
----------various indicators to help select potent and easy line patterns--------- 
line pattern -- anything line, revisited overall, 1, 2, 3, 4
line patterns, general discussion of
a random chart game (from here)
(Line patterns are chosen from shapes.)
-------------------
new ideas
05172010
Separate my line patterns into five types:
serial t:m, pattern (~parallel) t:m, s/p t, s/p m, and s/p t:m.
The differentiating letters are s, p, t, m and all, in order of type.
Examples, in order of types:
logr cycle / condensed-logr;
backwards, substitute or screen (see 'bar channels' post #1, ideas list with dates), involving pattern repetition in form or function;
bsTLs' small to large spread patterns;
corner, i.e. grid, when can draw a grid from how levels of ninety-degree angle between them; and,
a pattern with an obvious end pivot whose TL goes through a midline or a single pattern's center line that corresponds implicitly if askew with a later midline (see the multiple white lines picture in 'bar channels' post #1, same place as before.) )
Then, break down a chart area as mostly pertaining to the s/p t:m type of TL's, either with the complex repetition and set area (if not -effect for their TL's) of s or p t:m's or with the simple (non)repetition and variable area of s/p t's or m's. This is what the template example in the 'bar channels' post #1 had under today's date, using the former through condensed logr and a backwards TL set (except not shown on the template (here it is.)
leverage that decides each type, in order of type given above: shape, shape and line, dot, dot and line, line
This ordering idea fits in with shape areas, since there's the shapes, then a dividing line, and finally dots in and around each dividing line that one draws TL's from. The TL's with shape areas' dividing lines tend to fit in with each other sequentially from one shape-area dividing line to the next (ex's in post lost). Because it includes a potpourri of everything, the shape areas idea is of the s/p t:m kind.
04242010
shape TL's
overall:
It's shape areas, only to use one TL-producing shape each general higher-TF area (EST (mb trading)).
recent: 1,2,3,4,5.
This 1' series probably needs to be redone to use what learned, that is, shape TL's, especially the lack of frame TL's and also a triangle at the beginning. It uses lower TFs' pieces of shapes (dots, line segments,partial curves) as well.
03292010
shapes
*definition: A shape (with concepts within - outside of, to -from)
*condition: level (isolate (1 pt), level (2 pts), balance (3+pts)) or unlevel (expand, converge, irregular)
*scale: individual, exchange, or area
*type: reframe (a 90-degree corner with a 45-degree line from the corner; two slightly skewed, parallel lines with a midline between them for a third line; a one-pip bar then a vertical series of spinning tops, or visa-versa) or anchor (a line with small patterns progressing along it to a turn, a line with a few small and then a very large pattern and then nothing for a long time progressing along it to intersect after another area's turn; a vertical series of spinning tops, then zero or more one-pip bars, then another vertical series of spinning tops)
cog-pulley-weight approach
----------------------
formerly:
how bsTL's fit in with spread patterns in logarithmic cycles
--------------------
last theory:
Added logarithmic shifts and/or unusual patterns with high-impact news, very longterm bsTL's, or other wave fans' shape adjusting to the shape areas idea in #61-2 for a 1' TF method, to draw a bsTL fan at the shifting center or recentering pattern / set of patterns of a wave. Method is consistent, doing the fans at regular intervals and providing which way the price-time line goes.
There's lots of justification for this one -- The weekly midlines generally feed into these types of general shape areas; shape areas are consistent and dependable; news is included in all its affect; trend is reasonably certain; lines close to each other and from different fans work together easily; and, lots of space is defined. Problems may be that one must turn TL rays into line segments, once a line stops being effective, in an effort to keep the chart legible; general trend often fails to translate into smaller chart areas, leaving almost and rather ineptly horizontal fan lines to deal with it; and, choosing general shape areas, unlike shape areas in #61-2, are visually found relative to lots of other possible ones, allowing a lot of leeway to say where any one area is.
next-to-last theory, which does allow for a longer-term approach for the above one (where #61-2 does the same for a shorter-term one):
Traditional patterns (triangles, flags, etc.) are each a collection of balance areas formed from small groups and their bs- (expands) or mid- (contracts) TL's in(ter) standard pattern areas.
-------------
Here's my old pattern recognition table (stocks' rl --> forex's balance patterns):
topics:
From the beginning of this thread, somewhat unconsciously, I strived to get one system for all patterns. Pairs (EUR/USD,) are richest in chart patterns; one example is multiple-shape, heiken-ashi-candle patterns. I got to specific patterns (posts # 2-7,9), a developing context of purpose statements (8,16,27,35), an early several-pattern system (11, 18, 19). I also looked to automatic stuff along the way, to see what they had and to try and adapt it into something useable (drawing tools (posts 12,13,15,21,26(mostly) ) and indicators (posts 23,25,28,30-2,34,36,37,40,43) ). Finally, I had to take a break (6, 17,45-6), get discipline (33) and take others' advice ( after others' posts). My still-developing method begins at post 44 and charts news affect through my pattern recognition table ( ) and bar-spread trendlines.
(post 58+) This prt works with forex patterns superficially, in that it only considers balance patterns, which is forex's forte, with respect to roller language, which is (individual, especially smaller- (news-responsive)) stocks-appropriate. The product is only visually, not mathematically, measurable. Forex's balance patterns can stand on their own; thus, this prt is dropped and I'm in search of a standard way to present a new understanding of balance patterns.
in e/u, #1-45 (more pattern than line); in g/u,#46-on (more line than pattern), with bsTL's (#46-on)
chart:
CDRW Spread, TicksSeparateVolume and/or other volume indicator(s), ToggleRegandHACandlesshift_v2, and a sessions indicator . Also, access to Forex Factory's red-flag news results.
other links: news and patterns; patterns that anchor chart with lines attached to it, to reframe impression with; candlestick patterns
Avoid my calls (1' demo) and oscillator or other idle talk -- Trading patterns is drawing-intensive.
-----
Part of the bsTL microverse: Overview, patterns (or, those with fewer or more candles), TF use, trading. (And its future: automatic; precise.)
.
perspective need:
confront/avoid,act/respond,follow (within bounds of each object: price-action's distance/directness
vs. forward, standard-distance plane of existence for object)
direct,hover over,entrain continue/extinct in / excludable within separate and bound
DRAWING DEVICE
dot-balanced shape: triangle/wedge; rectangle / wide s/r; ellipse/curve; temporary (1-, 2-sided)
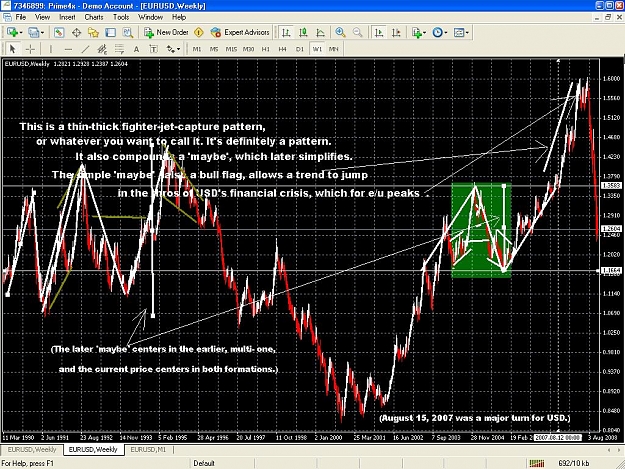
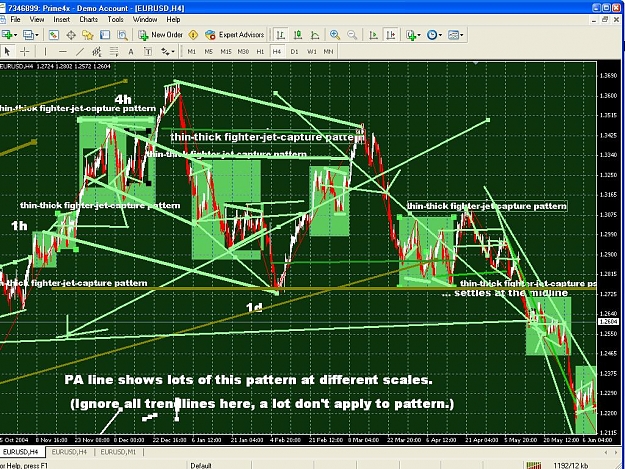
line-balanced shape(incl. angle,length of micro-trends): cup and handle / fighter jet; Gartley (etc.); centered,opposed shapes area
-- enhance (, shape): midline,logr,curve
-- multiply (, shape): grid; l.p.4 (screen,proxy); Gann (separate,extend)
area: count(fibo,fractal,whole(1/4,1/2,1/3,etc.))/rhythmic; multi-angle/condensed; random/volatile;
SERIES stability (flow(serial) w/ objects, each with a speed of attention(parallel)
----------
resources
free, drawable charts online -- 1,2,3,4,
short online games related to chart study: 1,
psychological games a trader may need: 1,2
brainwave freeware 1,2,3,4,5
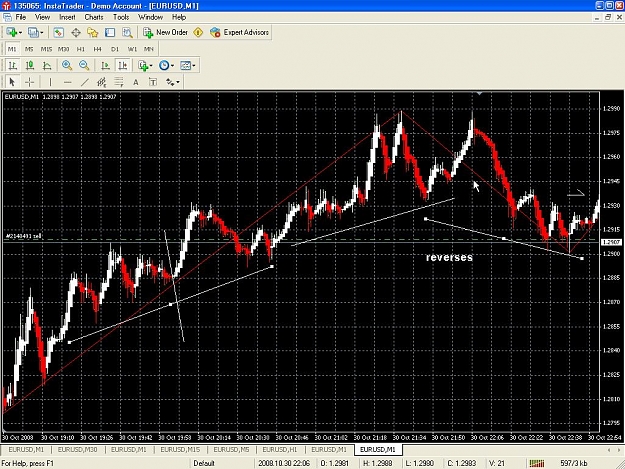
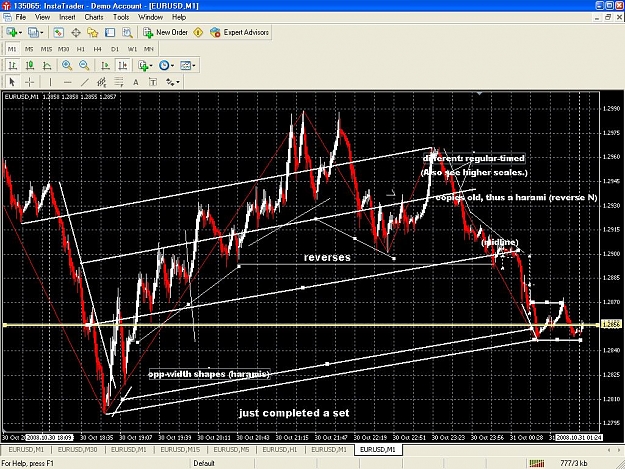
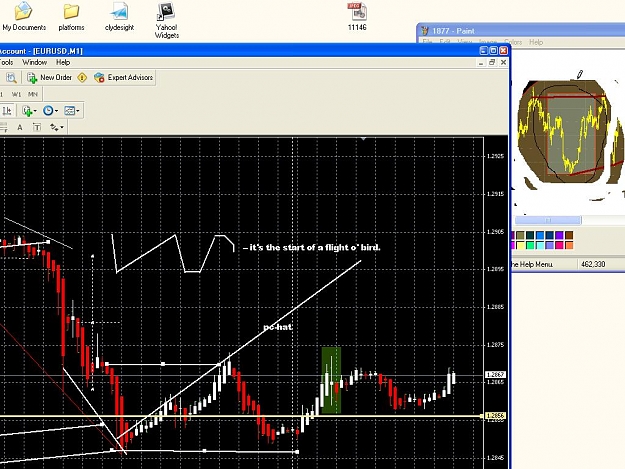
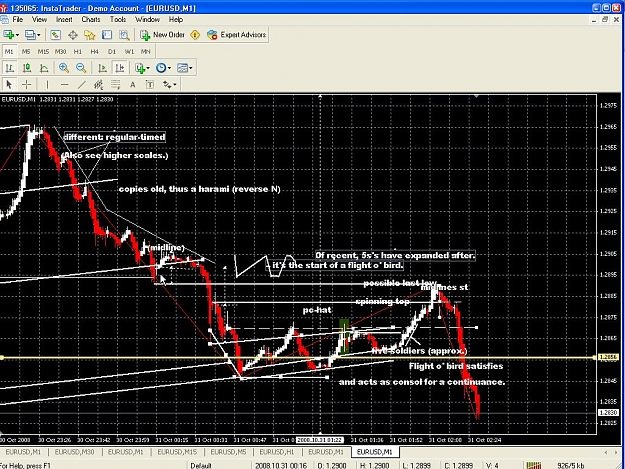
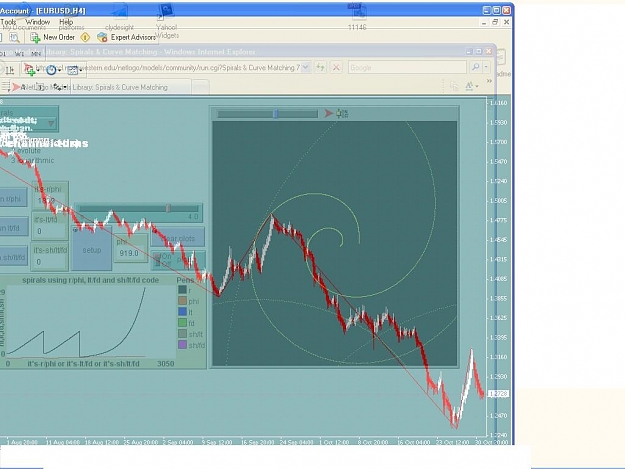
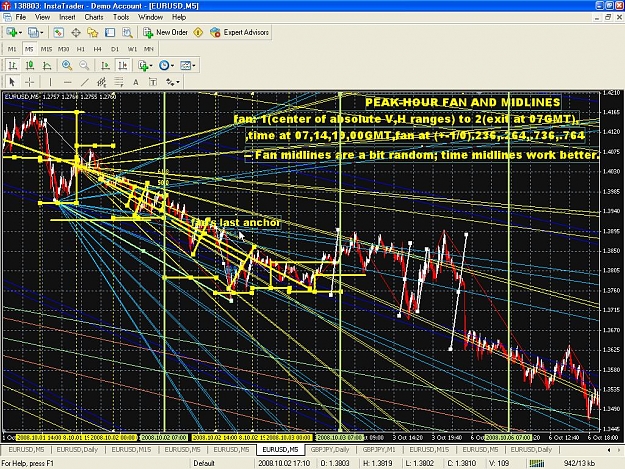
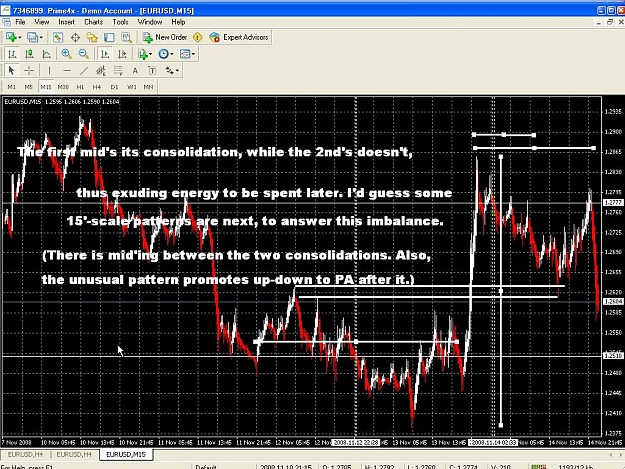
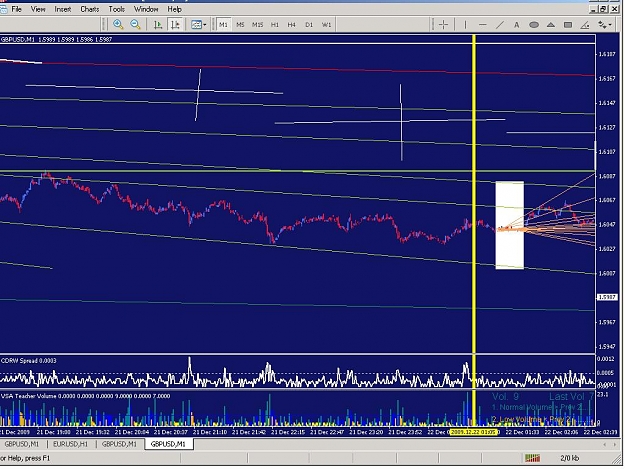
chart study
Attached Image (click to enlarge)
the 'fighter jet' and the (l.p.4: ) line proxy type of pattern I created -- see near bottom of journal, post 323.
Area, draw TL's from:
1. ellipse centerline on edge of
2. logr fan that is an
3. midline from or ninety-degree angle of
4. level opposition or hi-lo compromise to release or build pressure and turn from
5. aligned turn pivots, bunched runs inside, even waves, flat line or tiny balances
line patterns
This thread is a collection of older, developing ideas
of or addressed to a forex rookie.
index
From the beginning of this thread, somewhat unconsciously, I strived to get one system for all patterns. Pairs (EUR/USD,) are richest in chart patterns; one example is multiple-shape, heiken-ashi-candle patterns. I got to specific patterns (posts # 2-7,9), a developing context of purpose statements (8,16,27,35), an early several-pattern system (11, 18, 19). I also looked to automatic stuff along the way, to see what they had and to try and adapt it into something useable (drawing tools (posts 12,13,15,21,26(mostly) ) and indicators (posts 23,25,28,30-2,34,36,37,40,43) ). Finally, I had to take a break (6, 17,45-6), get discipline (33) and take others' advice ( after others' posts). My still-developing method begins at post 44 and charts news affect through my pattern recognition table ( ) and bar-spread trendlines.
(post 58+) This prt works with forex patterns superficially, in that it only considers balance patterns, which is forex's forte, with respect to roller language, which is (individual, especially smaller- (news-responsive)) stocks-appropriate. The product is only visually, not mathematically, measurable. Forex's balance patterns can stand on their own; thus, this prt is dropped and I'm in search of a standard way to present a new understanding of balance patterns.
in e/u, #1-45 (more pattern than line); in g/u,#46-on (more line than pattern), with bsTL's (#46-on)
__________________________________________________________________
ideas after 11222011:
ideas only in post #1 and older than 07232010:
description
candlesticks. Logarithm vs. midline nature of them. To go mostly only one way; or, express a deadlock between two of the same; or, a build one way and then a spasmodic letgo of that build due to crossed direction of pressure.
-------------LINE PATTERNS : four descriptions of types 1-5-------------
NAME (APPEARANCE)
1 internal (pivot/dot, level/line)
2 both/shape (blur)
3 repeated
4 rolling (differentiated / L:M-repeated)
5 castle (symmetric) opt. off rolling
CHARACTERISTIC (EXPRESSION OF PRESSURE)
1 a simple internal L:M relation
2 regular polygon (n=3-4, infinite: triangle, square, circle; to produce dot, line)
3 proxy line balancing the other TL's fro,at,to
4 dependent dot or line (set) the patterns related to it actively react with L:M-wise
5 parallel (hi,lo, mid true, mid natural, logr) lines
CONTINUITY (NO FALSE EXPRESSIONS OF OVERALL DIRECTION)
1 N with occasional partial Y help on pivot
2 somewhat random percent of Y
3 immediate N within pattern's area, then Y for a medium while after
4 Y within its set area and then during TLs' affect
5 Y, multiply divided (only split, with rolling) and thus, in a sense, forever
CONTROL (LENGTH OF HOLD PRESSURE HAS ON DIRECTION)
1 immediate
2 shape-dependent
3 moderate
4 proportional (while others do)
5 reframes continuously (anchors for longterm, off rolling)
----------various indicators to help select potent and easy line patterns---------
- Volume Teacher v4. High-volume candles, very low then very low - volume candles, low-volume candles. Matching, opposing price range in the bar(s)/candle(s); helps select more potent TL's when mixed with other indicators.
- 1,2,3,5,8,13,21,34 sma's, single color (personal, likely not ideal, choices) on 'None' most of the time). V's and tiny circles with all lines within them. Price-time line progression along horizontal TL segments.
- Market Hours. 2-12 pm volatile, 12-2 calm, 1-3 pm turn. Opposing repetition, change in trend.
- DutchCandle. Ordered (ex.'s: solid, spike, logr-curved ramp, flat ramp, flat, mountain, valley, and plateau) shapes to figure direction and draw TL's from.
- Zigzag. Symmetry (pivot trend) angles. Entire-area pivot switches, repeated logr's from one s/r touch to the next, and others. A native sense of the angles helps, especially in speedy read of chart.
- and others
examples example 1: slideshow, template; ex 2: s, t; ex 3: s, t; ex 4: s, t
.
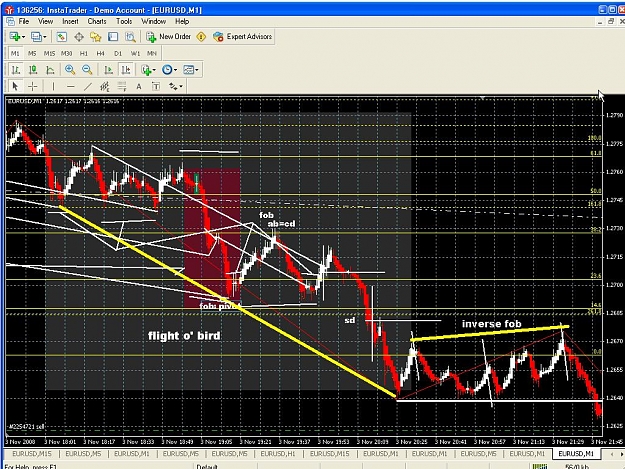
____________________________________
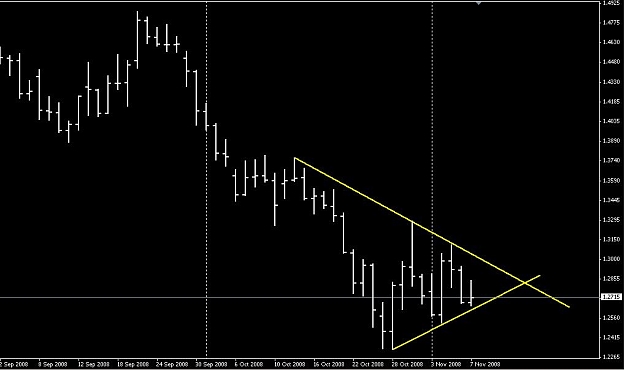
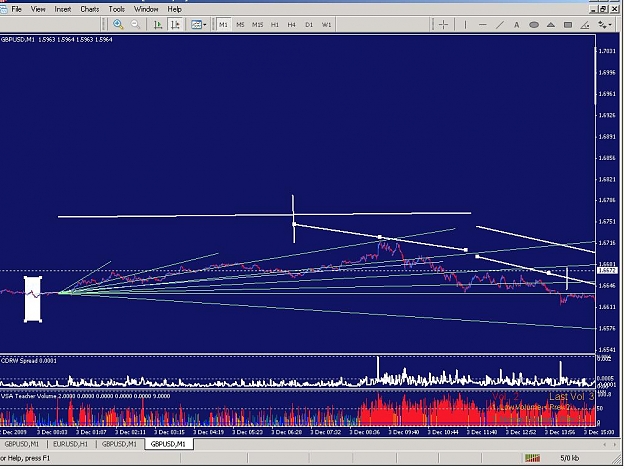
TL's named for purpose
Attached Image (click to enlarge)
line pattern -- anything line, revisited overall, 1, 2, 3, 4
line patterns, general discussion of
a random chart game (from here)
(Line patterns are chosen from shapes.)
-------------------
new ideas
05172010
Separate my line patterns into five types:
serial t:m, pattern (~parallel) t:m, s/p t, s/p m, and s/p t:m.
The differentiating letters are s, p, t, m and all, in order of type.
Examples, in order of types:
logr cycle / condensed-logr;
backwards, substitute or screen (see 'bar channels' post #1, ideas list with dates), involving pattern repetition in form or function;
bsTLs' small to large spread patterns;
corner, i.e. grid, when can draw a grid from how levels of ninety-degree angle between them; and,
a pattern with an obvious end pivot whose TL goes through a midline or a single pattern's center line that corresponds implicitly if askew with a later midline (see the multiple white lines picture in 'bar channels' post #1, same place as before.) )
Then, break down a chart area as mostly pertaining to the s/p t:m type of TL's, either with the complex repetition and set area (if not -effect for their TL's) of s or p t:m's or with the simple (non)repetition and variable area of s/p t's or m's. This is what the template example in the 'bar channels' post #1 had under today's date, using the former through condensed logr and a backwards TL set (except not shown on the template (here it is.)
leverage that decides each type, in order of type given above: shape, shape and line, dot, dot and line, line
This ordering idea fits in with shape areas, since there's the shapes, then a dividing line, and finally dots in and around each dividing line that one draws TL's from. The TL's with shape areas' dividing lines tend to fit in with each other sequentially from one shape-area dividing line to the next (ex's in post lost). Because it includes a potpourri of everything, the shape areas idea is of the s/p t:m kind.
04242010
shape TL's
overall:
Attached File(s)
It's shape areas, only to use one TL-producing shape each general higher-TF area (EST (mb trading)).
recent: 1,2,3,4,5.
This 1' series probably needs to be redone to use what learned, that is, shape TL's, especially the lack of frame TL's and also a triangle at the beginning. It uses lower TFs' pieces of shapes (dots, line segments,partial curves) as well.
03292010
shapes
*definition: A shape (with concepts within - outside of, to -from)
*condition: level (isolate (1 pt), level (2 pts), balance (3+pts)) or unlevel (expand, converge, irregular)
*scale: individual, exchange, or area
*type: reframe (a 90-degree corner with a 45-degree line from the corner; two slightly skewed, parallel lines with a midline between them for a third line; a one-pip bar then a vertical series of spinning tops, or visa-versa) or anchor (a line with small patterns progressing along it to a turn, a line with a few small and then a very large pattern and then nothing for a long time progressing along it to intersect after another area's turn; a vertical series of spinning tops, then zero or more one-pip bars, then another vertical series of spinning tops)
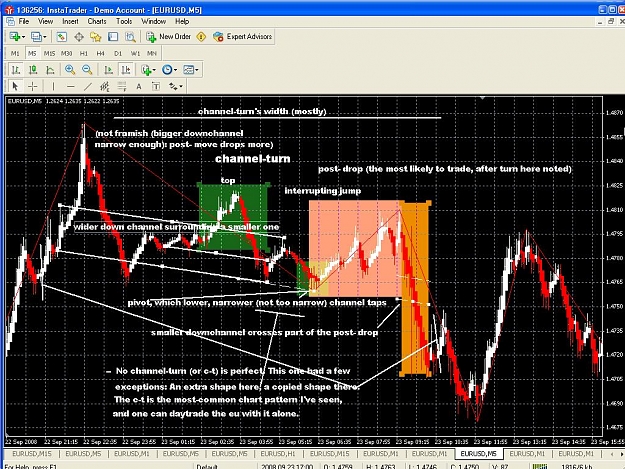
cog-pulley-weight approach
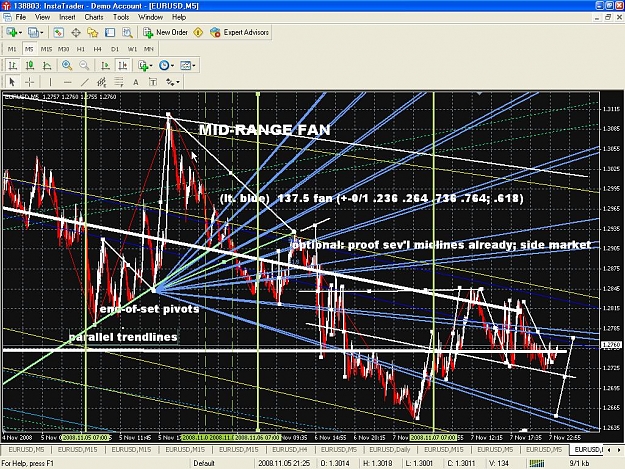
Attached Image (click to enlarge)
----------------------
formerly:
how bsTL's fit in with spread patterns in logarithmic cycles
--------------------
last theory:
Added logarithmic shifts and/or unusual patterns with high-impact news, very longterm bsTL's, or other wave fans' shape adjusting to the shape areas idea in #61-2 for a 1' TF method, to draw a bsTL fan at the shifting center or recentering pattern / set of patterns of a wave. Method is consistent, doing the fans at regular intervals and providing which way the price-time line goes.
There's lots of justification for this one -- The weekly midlines generally feed into these types of general shape areas; shape areas are consistent and dependable; news is included in all its affect; trend is reasonably certain; lines close to each other and from different fans work together easily; and, lots of space is defined. Problems may be that one must turn TL rays into line segments, once a line stops being effective, in an effort to keep the chart legible; general trend often fails to translate into smaller chart areas, leaving almost and rather ineptly horizontal fan lines to deal with it; and, choosing general shape areas, unlike shape areas in #61-2, are visually found relative to lots of other possible ones, allowing a lot of leeway to say where any one area is.
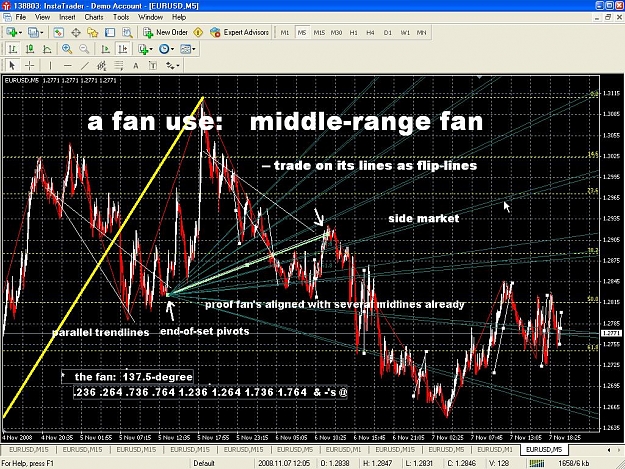
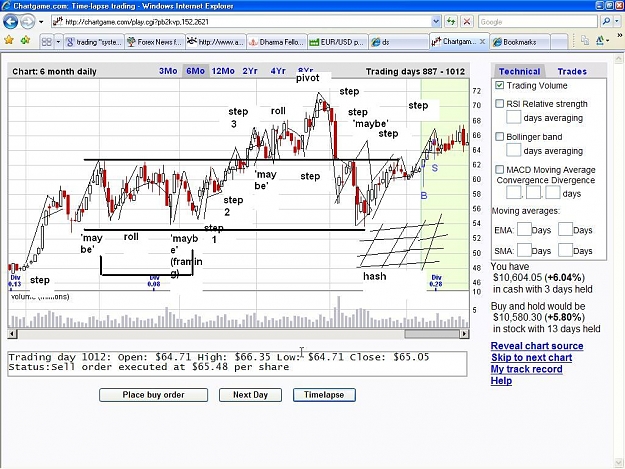
Attached Image (click to enlarge)
Attached Image (click to enlarge)
next-to-last theory, which does allow for a longer-term approach for the above one (where #61-2 does the same for a shorter-term one):
Traditional patterns (triangles, flags, etc.) are each a collection of balance areas formed from small groups and their bs- (expands) or mid- (contracts) TL's in(ter) standard pattern areas.
-------------
Here's my old pattern recognition table (stocks' rl --> forex's balance patterns):
Attached File(s)
topics:
From the beginning of this thread, somewhat unconsciously, I strived to get one system for all patterns. Pairs (EUR/USD,) are richest in chart patterns; one example is multiple-shape, heiken-ashi-candle patterns. I got to specific patterns (posts # 2-7,9), a developing context of purpose statements (8,16,27,35), an early several-pattern system (11, 18, 19). I also looked to automatic stuff along the way, to see what they had and to try and adapt it into something useable (drawing tools (posts 12,13,15,21,26(mostly) ) and indicators (posts 23,25,28,30-2,34,36,37,40,43) ). Finally, I had to take a break (6, 17,45-6), get discipline (33) and take others' advice ( after others' posts). My still-developing method begins at post 44 and charts news affect through my pattern recognition table ( ) and bar-spread trendlines.
(post 58+) This prt works with forex patterns superficially, in that it only considers balance patterns, which is forex's forte, with respect to roller language, which is (individual, especially smaller- (news-responsive)) stocks-appropriate. The product is only visually, not mathematically, measurable. Forex's balance patterns can stand on their own; thus, this prt is dropped and I'm in search of a standard way to present a new understanding of balance patterns.
in e/u, #1-45 (more pattern than line); in g/u,#46-on (more line than pattern), with bsTL's (#46-on)
chart:
CDRW Spread, TicksSeparateVolume and/or other volume indicator(s), ToggleRegandHACandlesshift_v2, and a sessions indicator . Also, access to Forex Factory's red-flag news results.
other links: news and patterns; patterns that anchor chart with lines attached to it, to reframe impression with; candlestick patterns
Avoid my calls (1' demo) and oscillator or other idle talk -- Trading patterns is drawing-intensive.
-----
Part of the bsTL microverse: Overview, patterns (or, those with fewer or more candles), TF use, trading. (And its future: automatic; precise.)
.